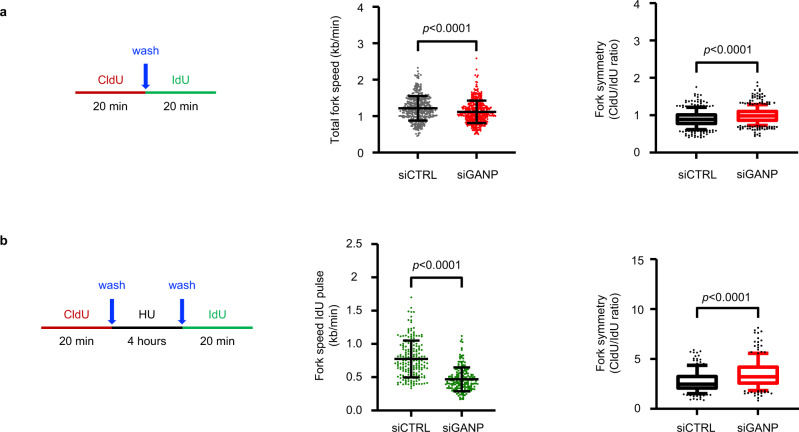
Fig. 5. GANP-depleted cells exhibit replication defects.
a DNA fiber analysis of the replication fork speed and symmetry in nontreated conditions. Left: schematic of the CldU/IdU pulse-labeling protocol used. Middle: analysis of the replication fork speed. Total number of molecules analyzed: siCTRL (n = 362), siGANP (n = 407). The plot includes the mean ± SD. Statistical test: unpaired t-test with Welch’s correction, two-tailed. Right: analysis of the replication fork symmetry. The ratio between CldU/IdU was calculated from the same molecules used for the analysis of the replication fork speed (middle) (siCTRL n = 362, siGANP n = 407). Bounds of box are 25th–75th percentile, center shows the median, whiskers indicate the 10th–90th percentiles, data outside the range are drawn as individual dots. Statistical analysis: unpaired t-test with Welch’s correction, two-tailed. b DNA fiber analysis of the replication fork recovery upon HU removal. Left: schematic of the CldU/IdU pulse-labeling protocol used. Middle: length of the IdU tracks measured upon hydroxyurea removal. Total number of molecules analyzed: siCTRL (n = 190), siGANP (n = 181). The plot includes the mean ± SD. Statistical test: unpaired t-test with Welch’s correction, two-tailed. Right: analysis of the replication fork symmetry. The ratio between CldU/IdU was calculated from the same molecules used for the analysis of the length of the IdU tracks measured upon hydroxyurea removal (middle) (siCTRL n = 190, siGANP n = 181). Bounds of box are 25th–75th percentile, center shows the median, whiskers indicate the 10th–90th percentiles, data outside the range are drawn as individual dots. Statistical analysis: unpaired t-test with Welch’s correction, two-tailed.

