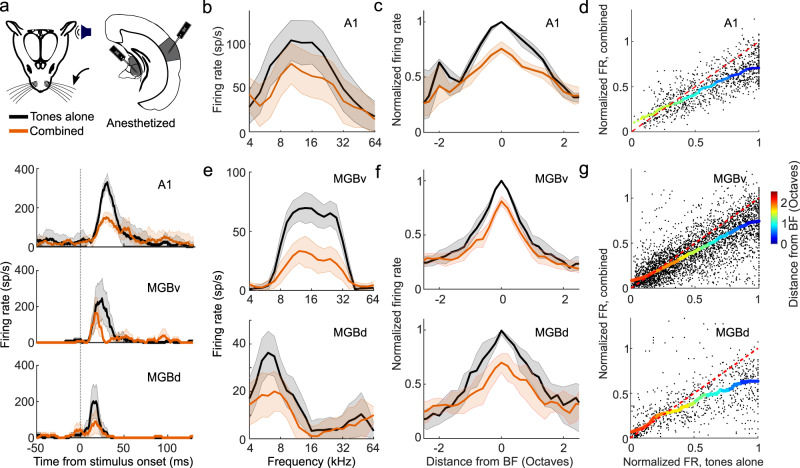
Fig. 2. Divisive scaling of frequency tuning by somatosensory inputs in the primary auditory cortex (A1) and the ventral and dorsal divisions of the medial geniculate body (MGBv and MGBd) of anesthetized mice.
a Top: Schematic of recording setup. Bottom: Example PSTHs illustrating best frequency (BF) responses with (orange) or without (black) concurrent whisker stimulation from units in A1, MGBv, and MGBd. b Example frequency response profiles with or without concurrent whisker stimulation from the same A1 unit. sp/s, spikes per second. c Median tuning curve across units recorded in A1 (change in BF response: P = 3.6 × 10⁻¹², n = 77, two-sided Wilcoxon signed-rank test). d Relationship between normalized firing rate (FR) for all A1 units (black dots) for tones across all frequencies presented either with (“combined”) or without (“tones alone”) whisker stimulation. e Frequency response profiles from the same MGB (top: MGBv, bottom: MGBd) units depicted in a either with or without concurrent whisker stimulation. f Median frequency response profiles across units recorded in MGBv (top, change in BF response: P = 2.5 × 10⁻¹⁶, n = 145, two-sided Wilcoxon signed-rank test) and MGBd (bottom, change in BF response, P = 1.3 × 10⁻⁴, n = 31, two-sided Wilcoxon signed-rank test) with or without concurrent whisker stimulation. g Relationship between normalized firing rate (FR) for all units (black dots) recorded in the MGBv (top) and MGBd (bottom) for tones across all frequencies presented either with (“combined”) or without (“tones alone”) whisker stimulation. Thick multi-colored lines show the running median of this relationship (window: 0.1 normalized firing rate), and the colors denote the distance from BF. The diagonal dashed red line is the line of equality. A larger distance between the multi-colored line and the diagonal line at the blue end than at the red end indicates divisive scaling. The shaded area indicates the s.e.m. (a), the 95% confidence intervals of the means (b, e), or the 95% nonparametric confidence intervals of the median (c, f). nA1 = 77 (4 mice), nMGBv = 145 (9 mice); nMGBd = 31 (9 mice). See Supplementary Fig. 4 for similar results in awake, head-fixed mice.

