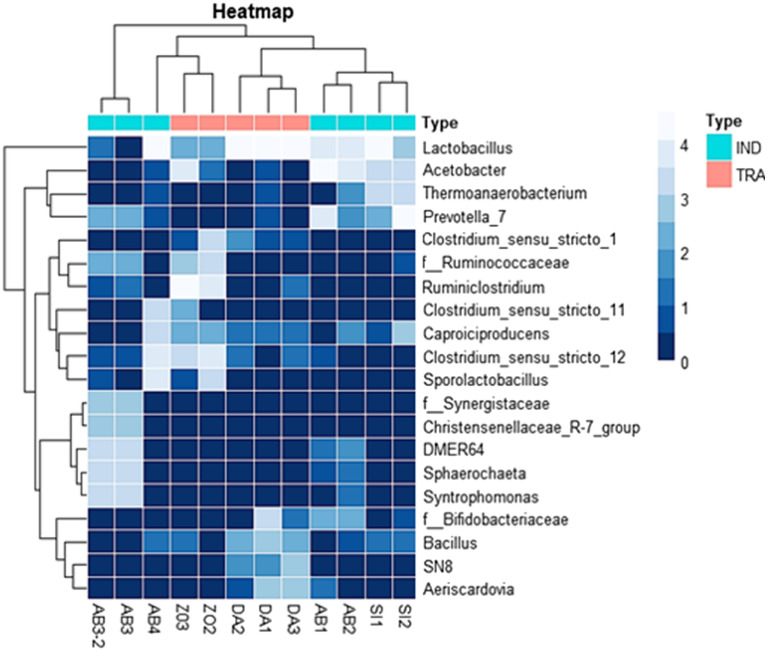
Figure 3.
A hierarchically clustered heat map shows the bacterial genus-level differential abundance in the two types (industrial and artisanal) of palm oil processing in Côte d’Ivoire. The significantly top 20 bacterial genera between the processing types clustered here. The ASV relative abundance data were normalized [log10 (xi + 1)-transformed] before generating the heat map using R version 3.6.3 software (https://cran.r-project.org/bin/windows/base/old/3.6.3/). The abundance difference is shown as a color key with a blue colour gradient. The sample distribution of the different palm oil processing types over the clusters is shown above the heat map.

