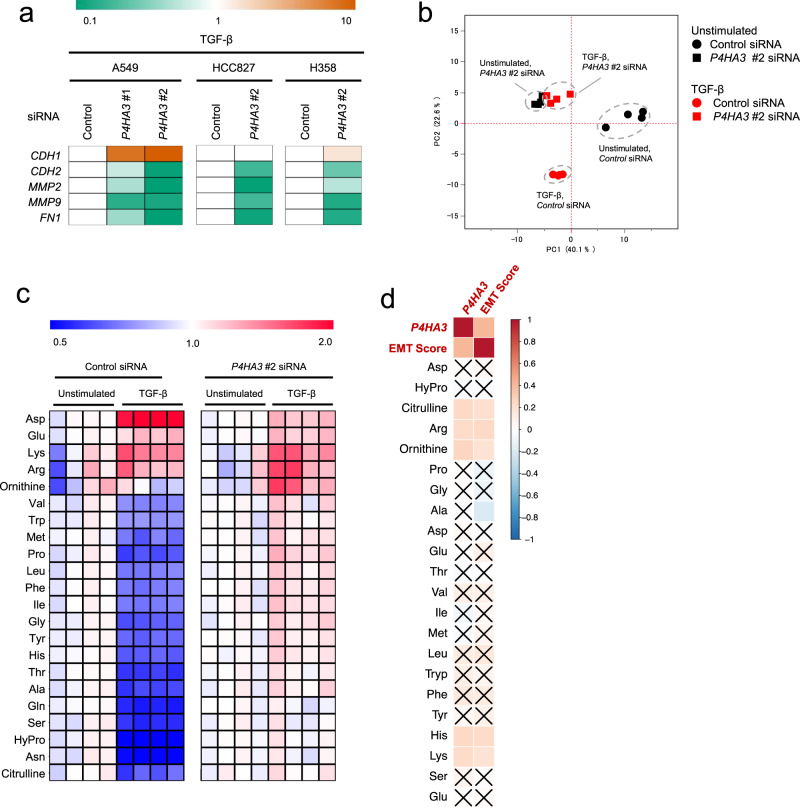
Fig. 5. Effect of P4HA3 knockdown on epithelial–mesenchymal transition (EMT) marker expression and altered amino acid metabolism in TGF-β-stimulated lung cancer cells.
a Effect of P4HA3 siRNA on EMT marker expression in TGF-β-treated A549, HCC827, and H358 cells. Cells transfected with P4HA3 siRNAs were treated with TGF-β for 48 h. mRNA expression levels of CDH1, CDH2, FN1, MMP2, and MMP9 were measured by real-time PCR. Orange and green indicate higher and lower levels, respectively, compared to mRNA levels in cells transfected with control siRNA (white). b Principal component analysis for metabolomics profiles of the P4HA3-knockdown A549 cells stimulated with or without TGF-β (n = 4). Metabolite levels were detected by capillary electrophoresis time-of-flight mass spectrometry. The black and red plots indicate unstimulated and TGF-β-stimulated, respectively, cells. The circle and square indicate control and P4HA3 siRNA-treated cells, respectively. c Effect of P4HA3 siRNA on TGF-β-induced amino acids alteration in A549 cells. Heat map depicts the ratios of measured sample to mean of unstimulated sample concentrations. Red and blue indicate higher and lower levels, respectively, of metabolites in TGF-β-stimulated cells compared to those in the unstimulated cells (white). d Correlations between amino acid levels, EMT score, and P4HA3 mRNA expression in NSCLC cell lines in the CCLE dataset. Positive correlation is indicated in red and negative correlation in blue. × indicates no significance (P > 0.05).

