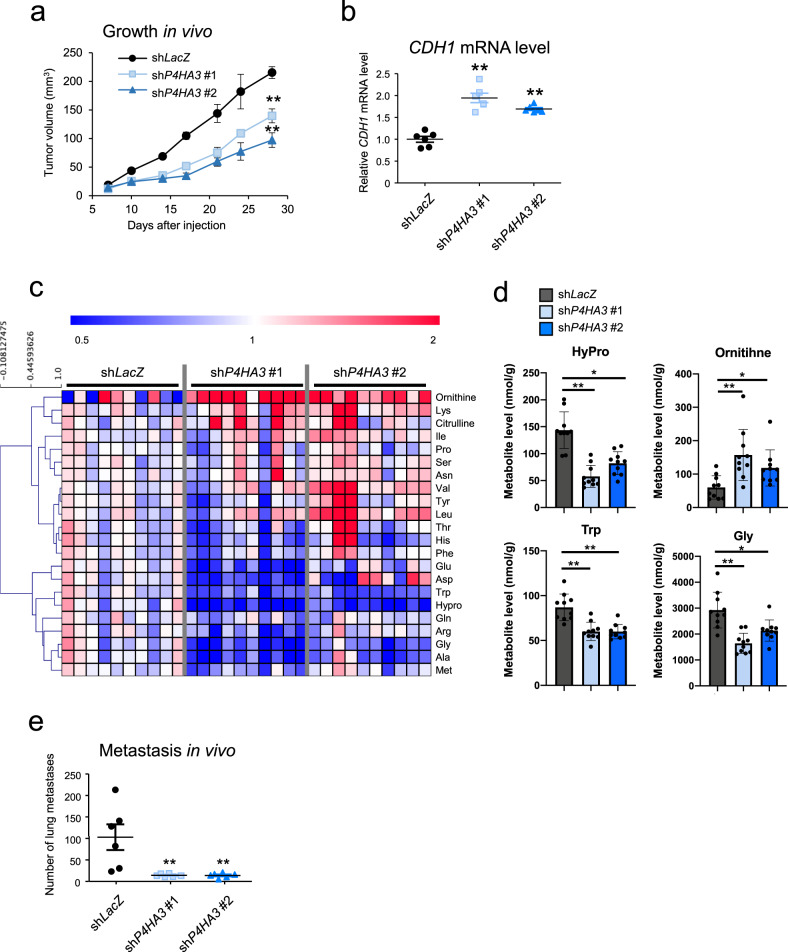
Fig. 7. Effect of P4HA3 depletion on tumor growth and metastasis in vivo.
a Rate of growth following subcutaneous implantation of control and P4HA3-knockdown A549 cells; n = 6 per group. Data represent mean ± SEM. **P < 0.01. b CDH1 mRNA levels in tumors derived from shLacZ, shP4HA3 #1, and shP4HA3 #2 A549 cells. c Altered amino acids in tumors derived from P4HA3-knockdown A549 cells (n = 10 per group). Metabolite levels in each sample were converted to a fold-change relative to the average metabolite level of the paired control (shLacZ). Red and blue indicate higher and lower levels, respectively, of metabolites in the P4HA3-knockdown tumors (shP4HA3 #1 and shP4HA3 #2) compared to those in the control tumors (shLacZ) (white). d Levels of hydroxyproline, Gly, Trp, and ornithine in the P4HA3 knockdown tumors. Data are presented as mean ± SEM. *P < 0.05, **P < 0.01. e Lung metastatic burden of i.v. injected control and P4HA3-depleted A549 cells 56 days after inoculation. Lung metastatic foci were counted; n = 6 per group. Data are presented as mean ± SEM. **P < 0.01.

