
Fig. 2.
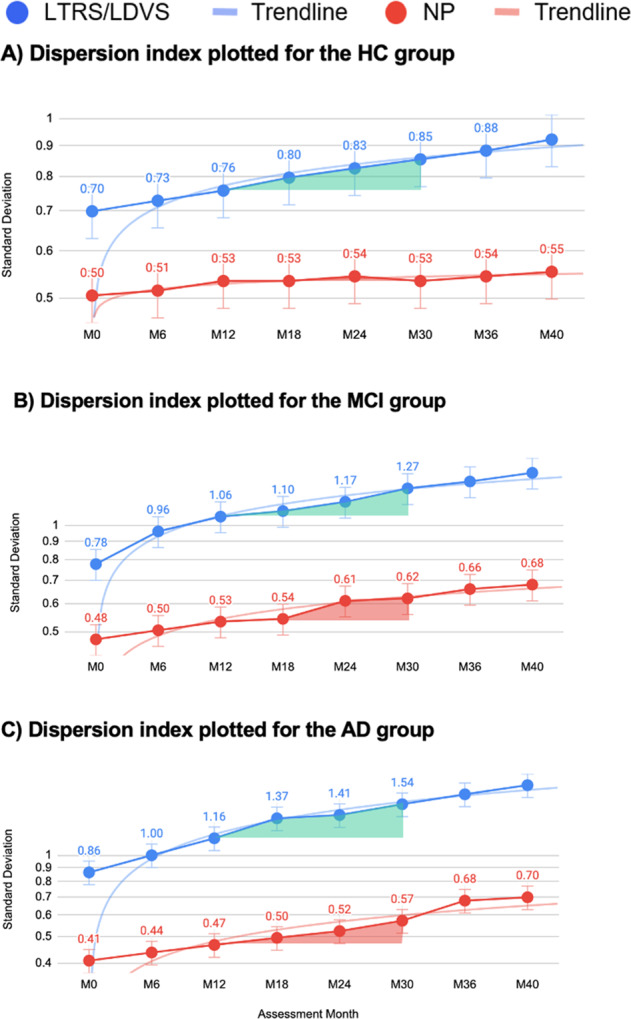
Dispersion index based on LTRS and NP plotted for for the HC (A), MCI (B), and AD (C) groups translated into standard deviation. The A–C graphs show a nonlinear increase in standard deviation as a function of disease trajectories. Comparing the overall mean of LTRS vs NP per group yields the following values: HC: t = 10.00106, p < 0.00001; MCI: t = 7.02195, p < 0.00001; AD: t = 6.65272, p = 0.000011, the results are statistically significant at p < 0.001. Details of the individual time points are shown in Table 1.