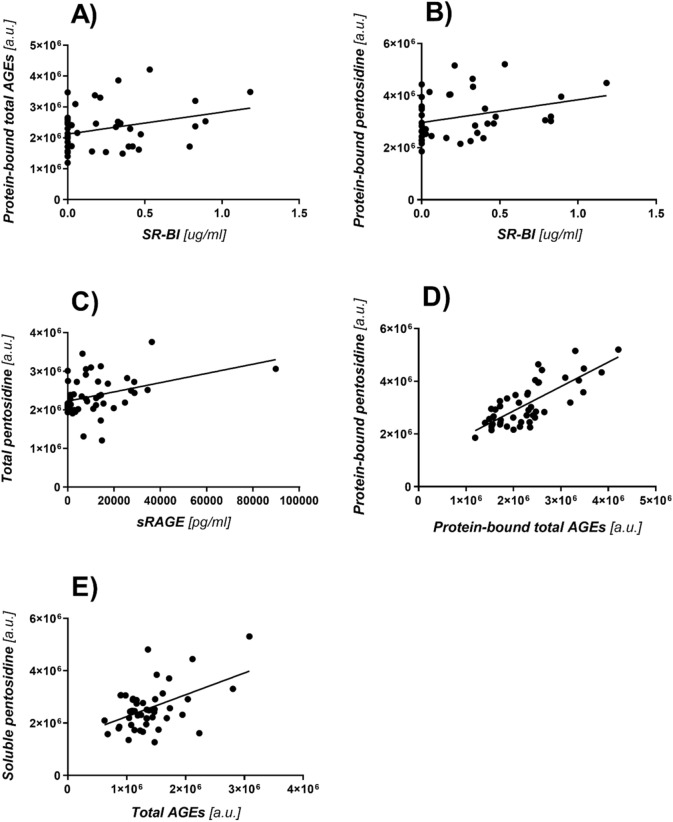
Figure 1.
(A) Graph of the correlation between the concentration of SRBI receptors and total AGEs bound to proteins, (p = 0.0493, r = 0.3052). (B) Graph of the correlation between SR-BI and pentosidine bound to proteins, (p = 0.0481, r = 0.3068). (C) Graph of the correlation between sRAGE and pentosidine measured in the whole sample, (p = 0.0094, r = 0.3675). (D) Graph of correlation between protein-bound total AGEs and protein-bound pentosidine, (p < 0.0001, r = 0.761). (E) Graph of the correlation of AGEs measured in the whole sample and soluble pentosidine, (p = 0.0006, r = 0.480).

