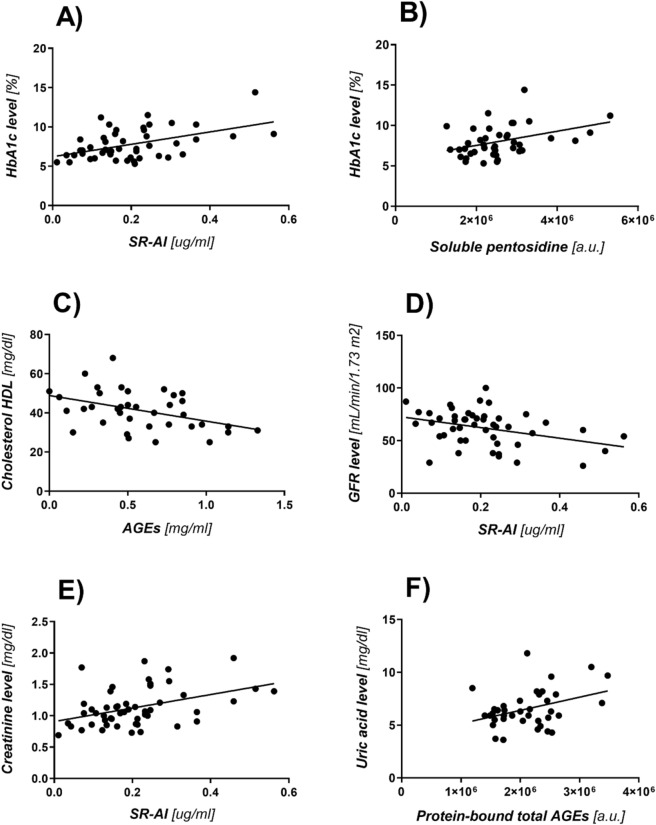
Figure 2.
(A) Graph of the correlation between the level of glycated hemoglobin HbA1c and the concentration of the SR-AI scavenger receptor in the samples. (B) Graph of the correlation between the level of glycated hemoglobin HbA1c and fluorescence of soluble pentosidine. (C) Graph of the correlation between the concentration of HDL and AGEs content in samples digested with proteinase K (the competitive ELISA test). Graph of the correlation between the levels of GFR. (D) and creatinine. (E) and the concentration of the SR-AI receptor in the serum samples. (F) Graph of the correlation between the level of uric acid and the fluorescence value of protein-bound total AGEs in the serum samples.

