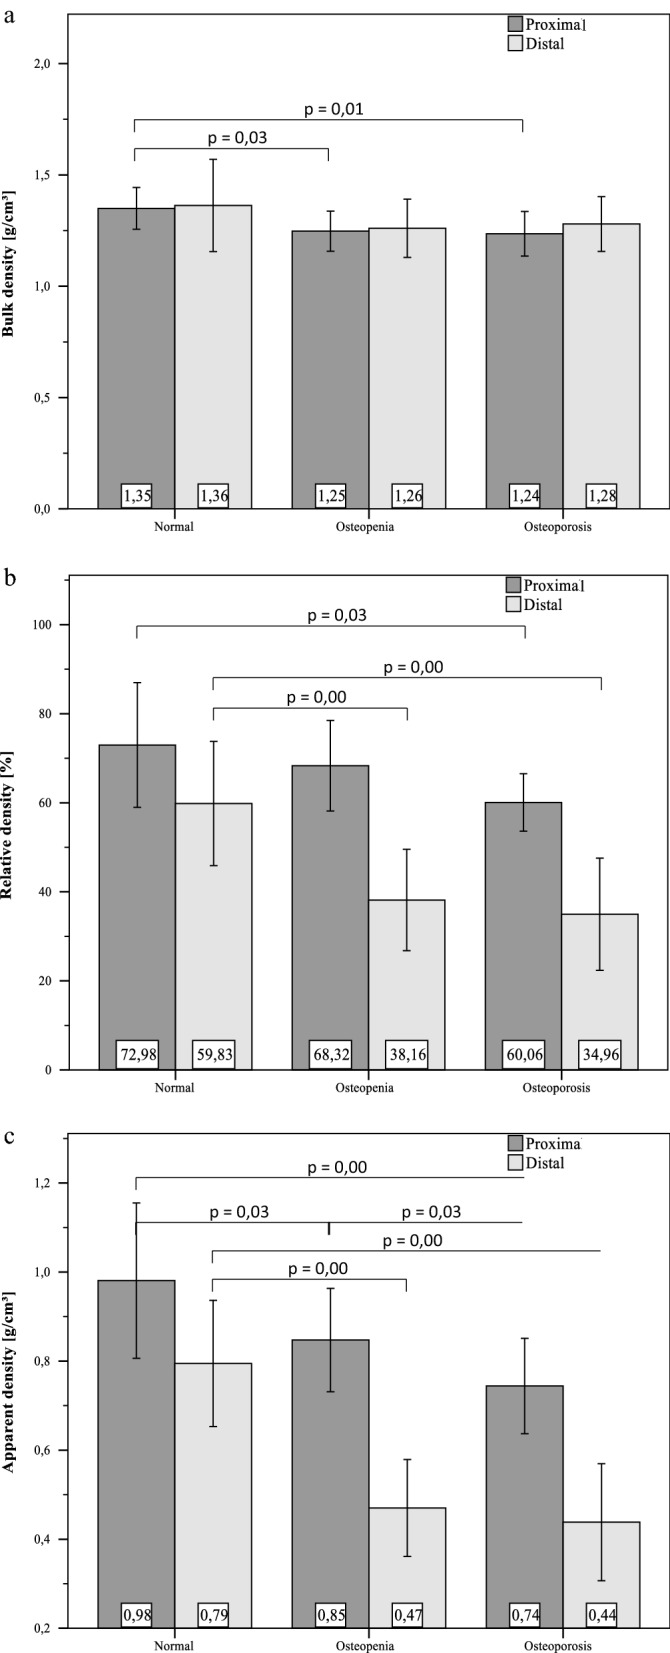
Figure 3.

Mean density values of the density samples collected proximally and distally oriented to the mechanical specimen. The data grouped regarding WHO classification for osteoporosis based on BMD measurements of each donor bone. Bulk density ρb (a) stays roughly constant with low differences between sites. Apparent density ρapp (b) and relative density ρr (c) show both great differences both between sites and groups. all significant differences are marked with their specific p-value from independent t-tests.
