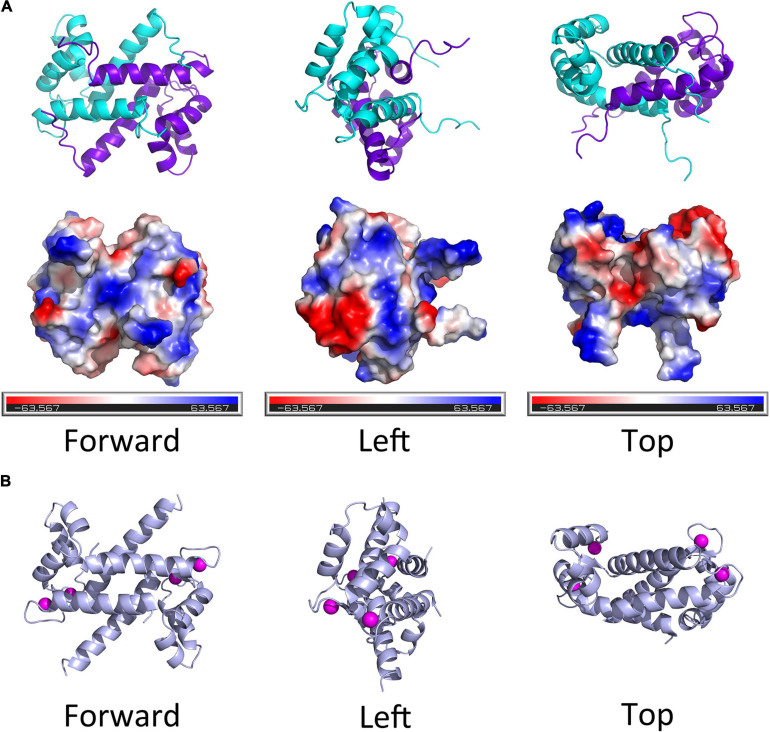
FIGURE 2.
The diagram of spatial structure of S100A11 protein. (A) Top panel, the 3D structure of human S100A11 homodimer. Bottom panel, the surface charge profile of 3D structure of S100A11 homodimer shown in the same orientation as top panel, the surfaces with negative charge, positive charge and hydrophobic are colored in red, blue and white, respectively. The PDB file that used to make the 3D structure of human S100A11 was from RCSB PDB (www.rcsb.org/structure/2LUC), the 3D structures were made by PyMOL software. (B) The pig (Sus scrofa) S100A11 homodimer with the calcium ions. The calcium ions are shown as pink balls. The PDB file that used to make the 3D structure of porcine S100A11 was from RCSB PDB (www.rcsb.org/structure/1qls), the 3D structures were made by PyMOL software.

