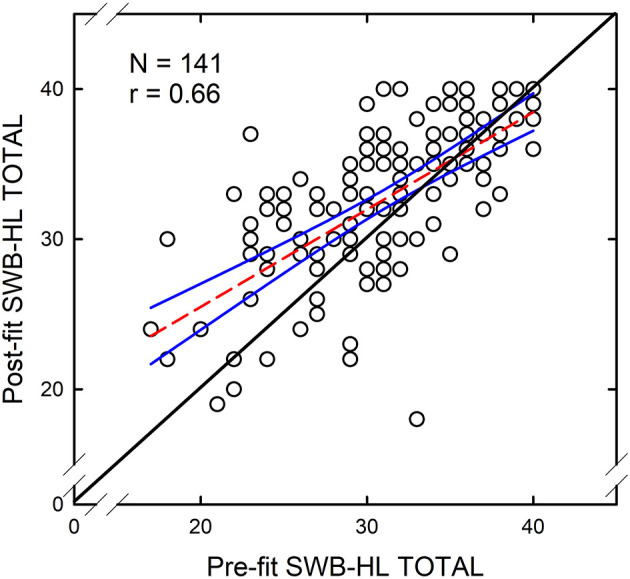
Figure 3.

Scatterplot of aided SWB-HL Total scores against unaided SWB-HL Total scores for 141 older adults fitted with hearing aids in this study. The correlation between these two scores was r = 0.66 (p < 0.001). Each circle represents an individual data point. The solid black line along the diagonal represents equality of the aided and unaided scores. The dashed red line is the best-fitting linear-regression equation and the blue lines represent 95% confidence intervals around that equation.
