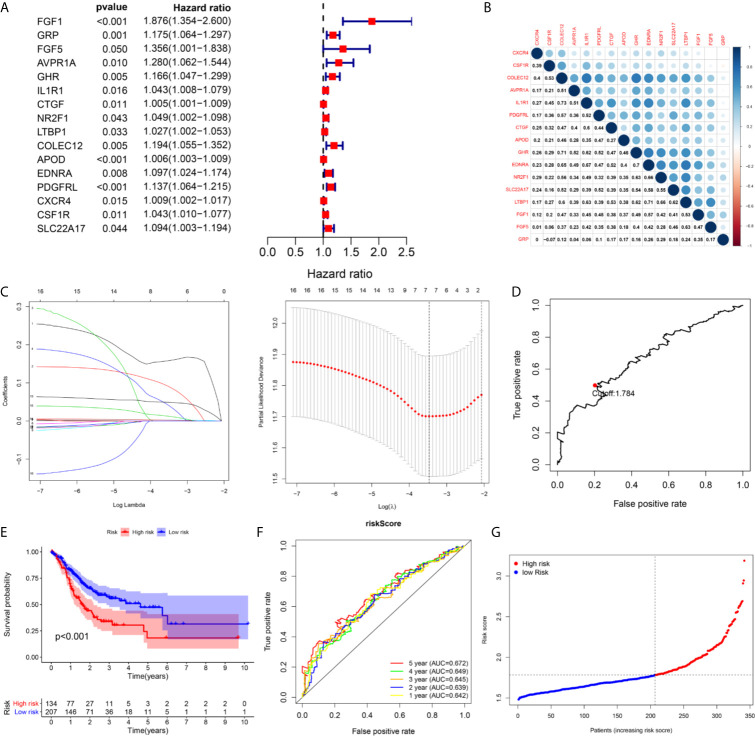
Figure 3.
The building process of the seven immune gene prognostic signature in the TCGA cohort. (A) The forrest plot of the univariate Cox analysis. (B) The corrplot of the prognostic related genes. (C) Lasso penalized COX regression analysis. (D) The optimal cutoff determined by 5-year time-depend ROC curve. (E, F) The Kaplan–Meier survival analysis and time‑dependent ROC analysis of the signature for predicting the OS of patients in the TCGA cohort. (G) The risk score distribution of patients in in the TCGA cohort.

