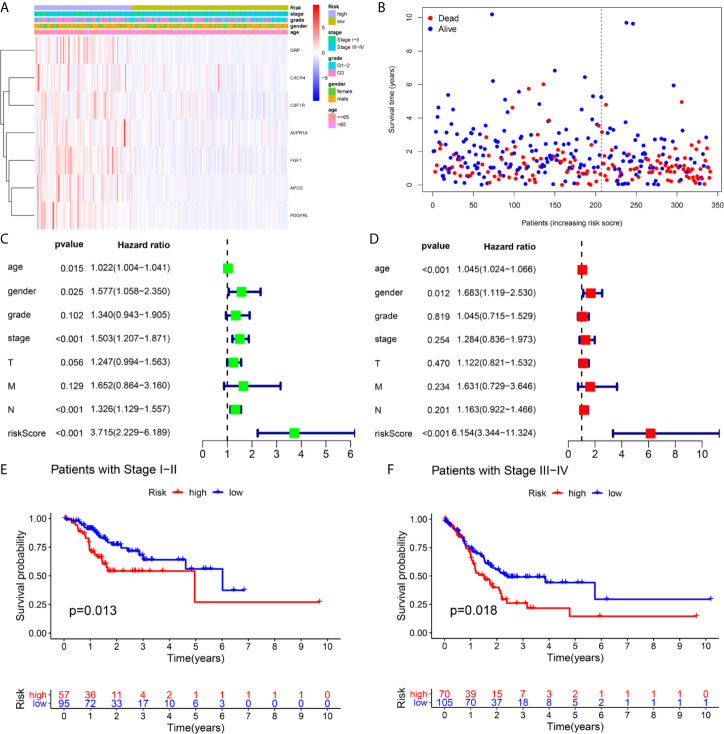
Figure 5.
Independence validation of the risk score in the TCGA cohort. (A, B) The heatmap, and the survival status of patients in in the TCGA cohort. (C) The forrest plot of the univariate Cox analysis. (D) The forrest plot of the multivariate Cox analysis. (E, F) Subgroup validation based on the clinical stage.

