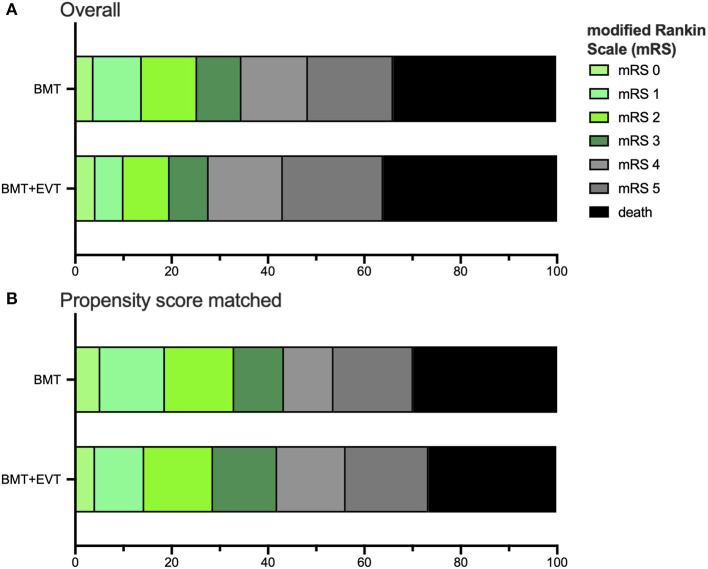
Figure 1.
Distribution of the modified Rankin scale (mRS) in all patients (A) and the Propensity Score matched data set (B) for age, mRS at admission, baseline NIHSS, and medical history, such as diabetes mellitus, arterial hypertension, and prior stroke. Comparing BMT vs. BMT plus EVT group, the mRS shift was not significant, neither for the all patients [OR 0.81 (0.56–1.19)] nor for Propensity Score matched patients [OR 0.98 (0.60–1.61)]. The ratio was estimated with ordinal logistic regression.

