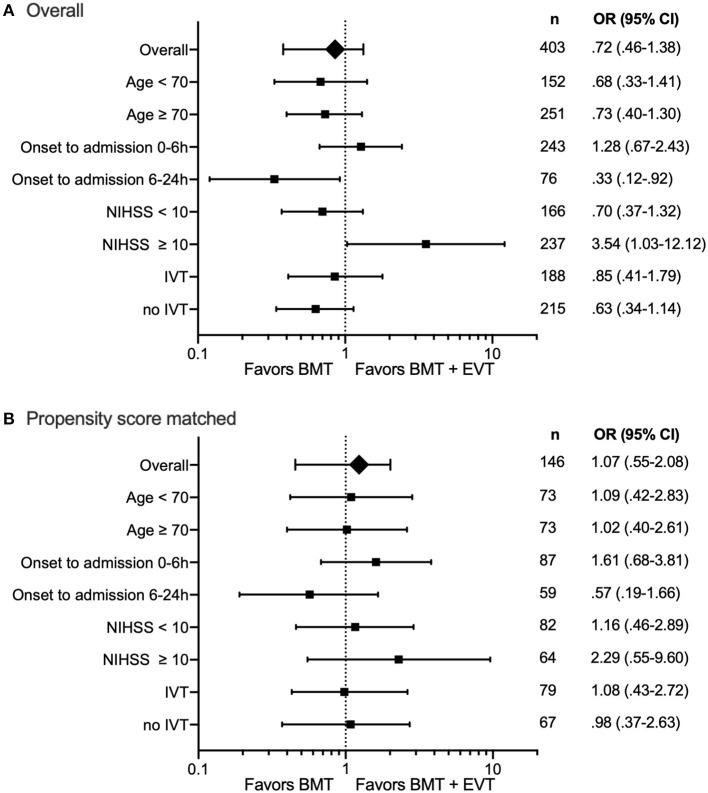
Figure 2.
Forest plot of additional endovascular therapy (EVT) on favorable outcome (mRS 0–3) at discharge from hospital. (A) includes all patients (n = 403). (B) Propensity Score matched data set (n = 146) for age, care situation prior to admission (independent at home, care at home, and care in institution), mRS at admission, baseline NIHSS, and medical history, such as diabetes mellitus, arterial hypertension, prior stroke, and time from onset to admission <24 h. Number of patients and odds ratio (OR) with 95% CI are presented.

