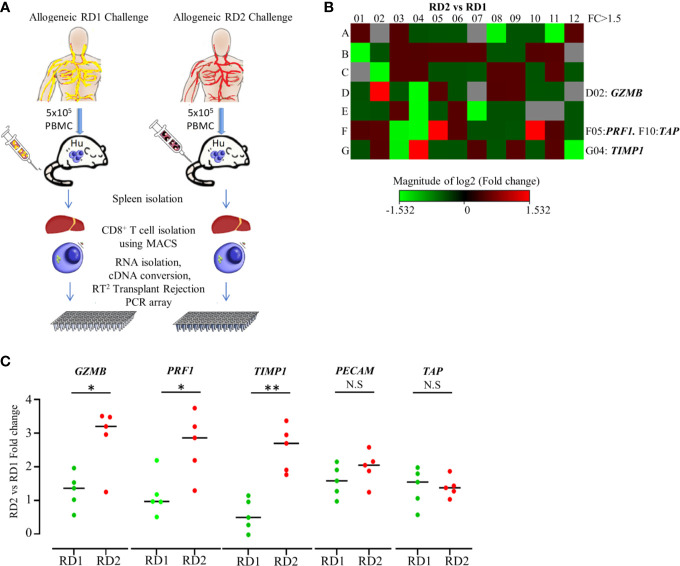
Figure 4.
Transplantation rejection genes are significantly upregulated in recipient’s CD8+ T cell’s allogeneic response to RD2. (A) Experimental design schematic illustrates allogeneic challenge of the humanized mouse with cells from RD1 and RD2 followed by spleen extraction, isolation of infiltrating hCD8+ T cells, and transcript analysis using RT2 Transplant Rejection PCR array. The gene expression was normalized to the average of three housekeeping genes (ACTB, GAPDH, HPRT), and expression of each gene relative to RD1 is depicted. (B) Heat map illustrates fold change of transplant rejection-specific genes in hCD8+ T cells of the allogeneic RD2 group in comparison to the RD1 challenge. Red indicates increased and green indicates decreased expression. (C) The specific gene expression patterns were confirmed by custom real-time PCR. Gene expression was normalized to GAPDH levels, and fold change in mRNA levels of each gene in the RD2 group compared to RD1 is shown. n= 5 mice per group. Data presented as mean ± SD.*p < 0.05, **p < 0.01. NS., not significant.

