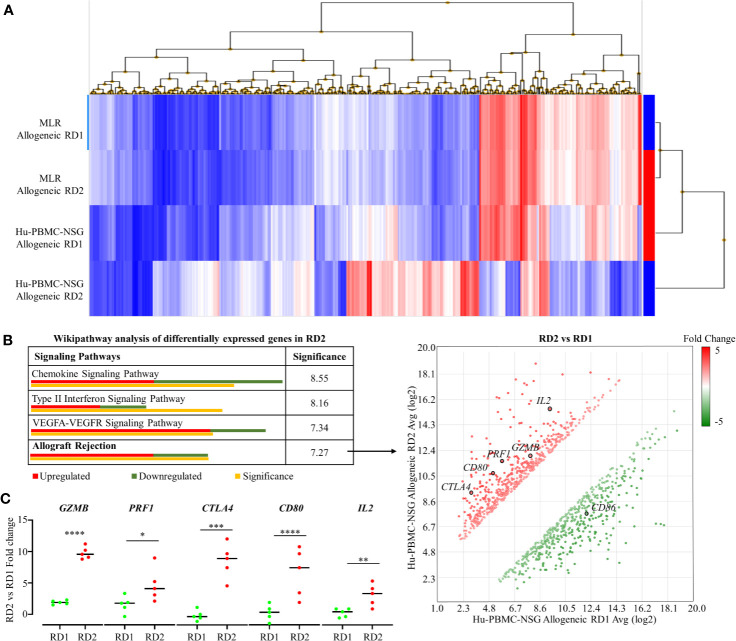
Figure 5.
Transcriptome analyses of recipient’s allogeneic responses generated in humanized mice demonstrate differences between related donors, which are indistinguishable in the MLR. (A) Human Gene 2.0 ST array was used to plot a heat map representing differential gene expression in hCD3+ T cells of the allogeneic RD1 and RD2 challenges for the MLR and the humanized mouse models. Hierarchical clustering was used to segregate individual gene expression in each group into reduced expression (blue) and over-expression (red) conditions. (B) Transcriptome Analysis Console was used to carry out pathway analysis on the differentially expressing genes in RD2 challenges of the humanized mouse model. The allograft rejection pathway had 12 significantly upregulated and 7 significantly downregulated genes depicted in the scatter plot. Significance was calculated using 2-sided Fisher’s exact test. (C) Custom RT-qPCR was carried out to confirm fold change of target genes integral for allograft rejection comparing the RD2 vs RD1 allogeneic challenges. n = 5 mice per group. Data presented as mean ± SD. *p < 0.05, **p < 0.01, ***p < 0.001, ****p < 0.0001.

