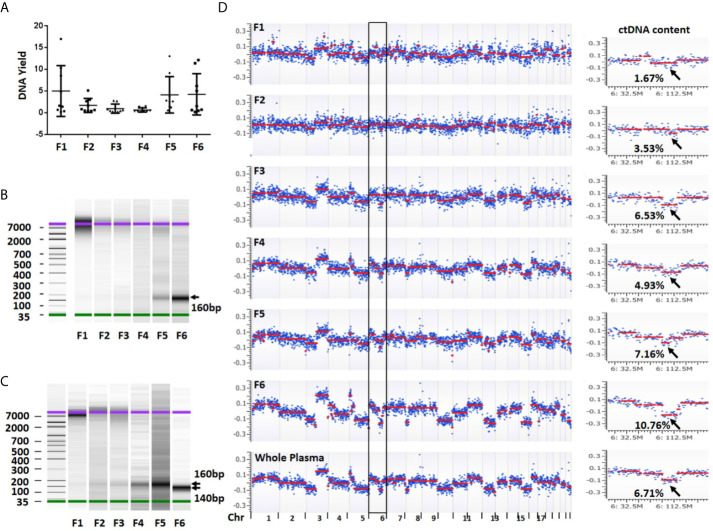
Figure 3.
DNA yield, size and overall view of genomic alterations in six fractions collected from a sequential centrifugation of 1 ml plasma sample. (A) DNA yield (ng) from six different fractions. (B) DNA size (bp) distribution in six plasma fractions of patient 1. (C) DNA size (bp) distribution in six plasma fractions of patient 7. (D) Overall view of genomic alterations in six plasma fractions and their corresponding whole plasma from patient 1. Segmentation-based copy number variation analysis shows different genomic variations across chromosomes 1–22. Most significant segments losses (arrows) on chromosome 6 were used to calculate ctDNA content. The log2 ratio scale in y axis was from −0.4 to 0.4. F1–6 represent fractions 1-6, respectively.

