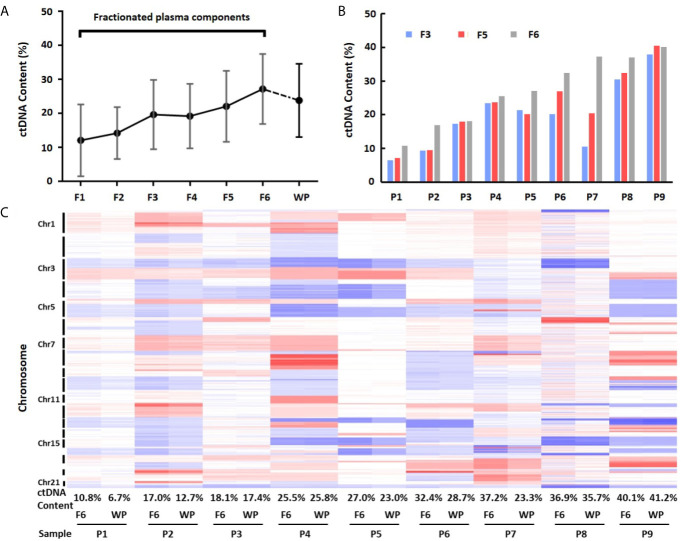
Figure 4.
Differences of ctDNA content in fractionated plasma components and whole plasma. (A) Overall view of ctDNA content from fractionated plasma components and whole plasma. The average ctDNA content is the highest in EVs-depleted fraction 6. (B) Differences of ctDNA content among fractions 3, 5 and 6. (C) Heatmap of log2 ratio in 1 Mb genomic window across chromosomes 1–22 in fraction 6 (F6) and whole plasma (WP) from nine patients (P1–P9). Red color represents copy number gain, while blue represents loss. Intensity of the color is proportional to the value of log2 ratio and reflects the weight of ctDNA in overall background cfDNA.

