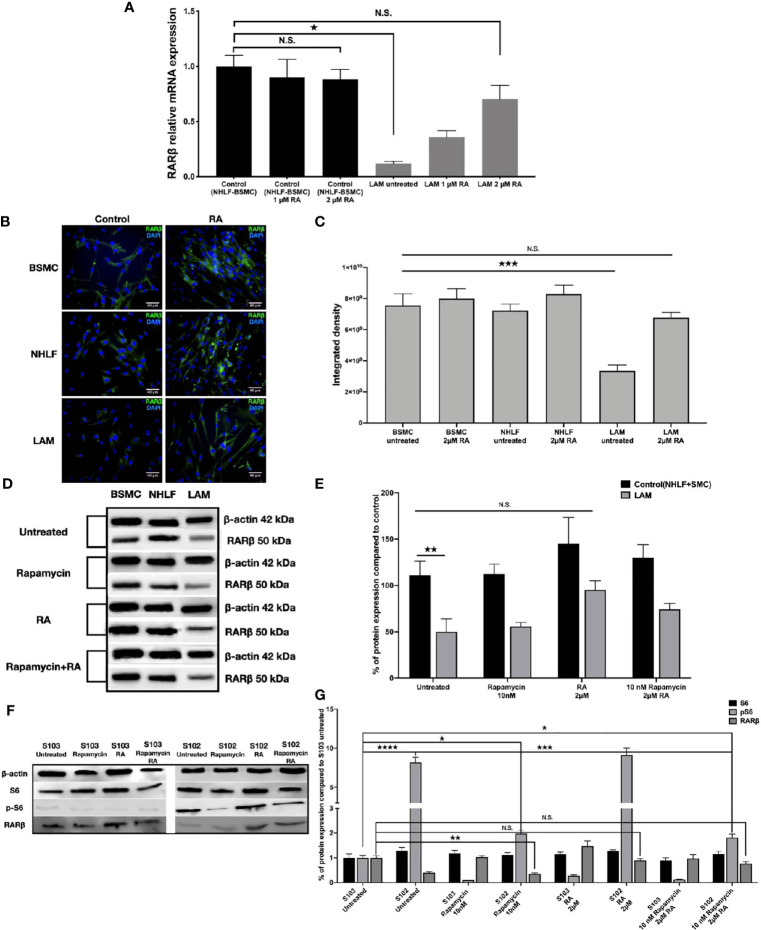
Figure 2.
Restoration of RARβ expression by RA. (A) mRNA expression levels of RARβ are significantly increased in LAM cell lines (n=4) compared to controls BSMC and NHLF after 2 μM RA treatment for 24 h. Significant changes are marked as ★ (P<0.05). (B, C), Protein expression levels of RARβ using immunofluorescence staining in LAM cell lines compared to controls (BSMC and NHLF) after 2 μM RA treatment for 24 h. Immunofluorescence staining RARβ green, DAPI blue, magnification 40x, size-bar 40 μm. (D, E) Western blot analysis of RARβ protein levels in LAM cell lines and control cells (NHLF and BSMC). (F, G) Western blot analysis of RARβ, S6 and pS6 protein levels in S102 cell line compared to S103. WB protein expression levels were quantified by ImageJ and are presented as percentage compared to controls. Changes are marked as N.S. (Non Significant) or significant ★, ★★, ★★★ and ★★★★ (P<0.05, P<0.001, P<0.0002 and P<0.0001, respectively).

