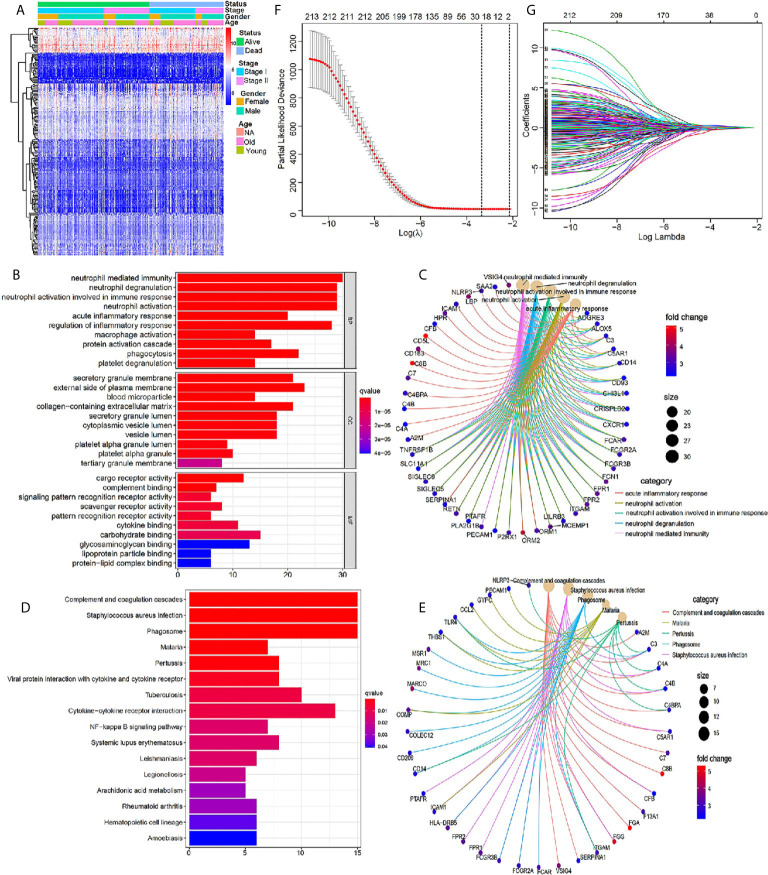
Figure 2.
Identification of core prognostic differentially expressed immune-related genes. (A) Heatmap showing gene expression value across each sample, and the distribution of status by patient gender, TNM stage and age. (B, C) GO analysis of the core prognostic differentially expressed immune-related genes. (D, E) KEGG analysis of the identified prognostic genes. (F) LASSO model selecting most useful parameter. (G) LASSO coefficient graph of the key prognostic immune-related genes.

