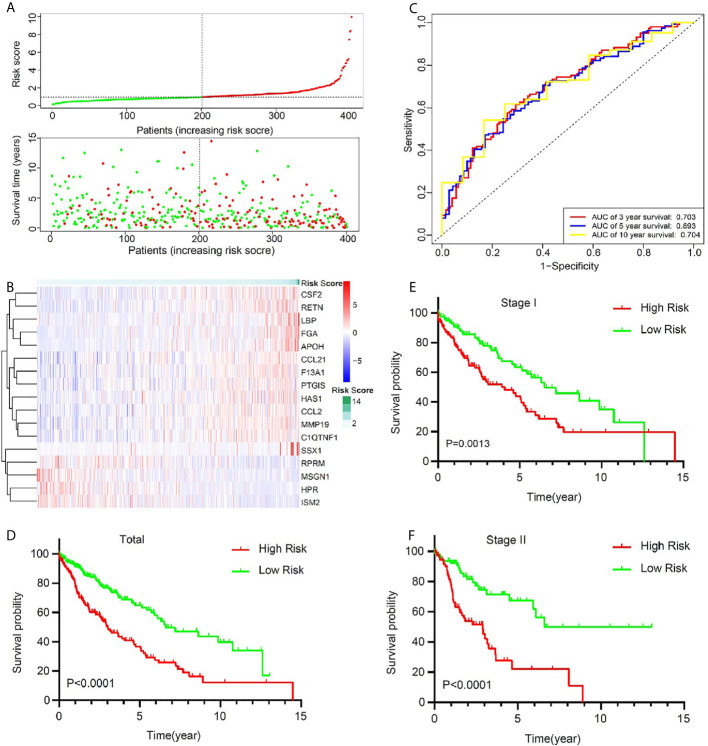
Figure 3.
The signature of key prognostic immune-related genes and their potential predictive value in early stage LUSC based on a TCGA training set. (A) The distribution of risk score and survival status. (B) Distribution of specific gene expression based on risk score. (C) ROC curves of these key genes to predict death risk at 3, 5, and 10 years in TCGA set. (D) Comparison of overall survival of all patients with early stage LUSC between high risk and low risk. (E, F) Kaplan–Meier curves of patients with stage I and stage II LUSC based on risk score.

