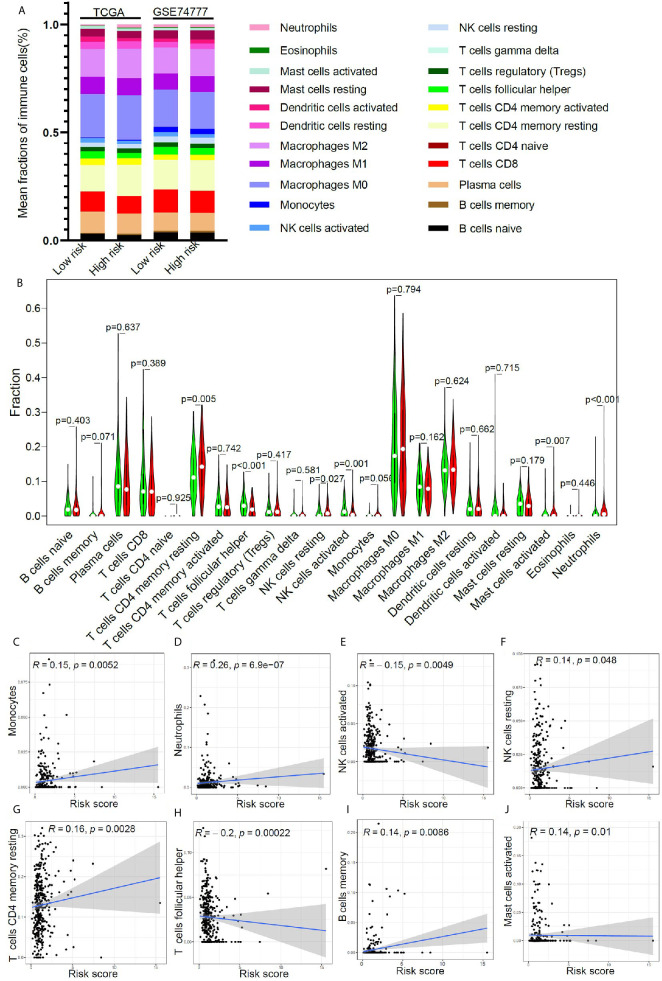
Figure 5.
The relationship between immune cell infiltration and risk score in early stage LUSC. (A) The distribution of tumor immune cell infiltration in high- and low- risk groups in TCGA cohort and GSE74777 set. (B) Comparison of tumor immune cell infiltration levels between high- and low-risk groups. (C–J) Correlation of risk score with immune cell infiltration levels in patients with early stage LUSC.

