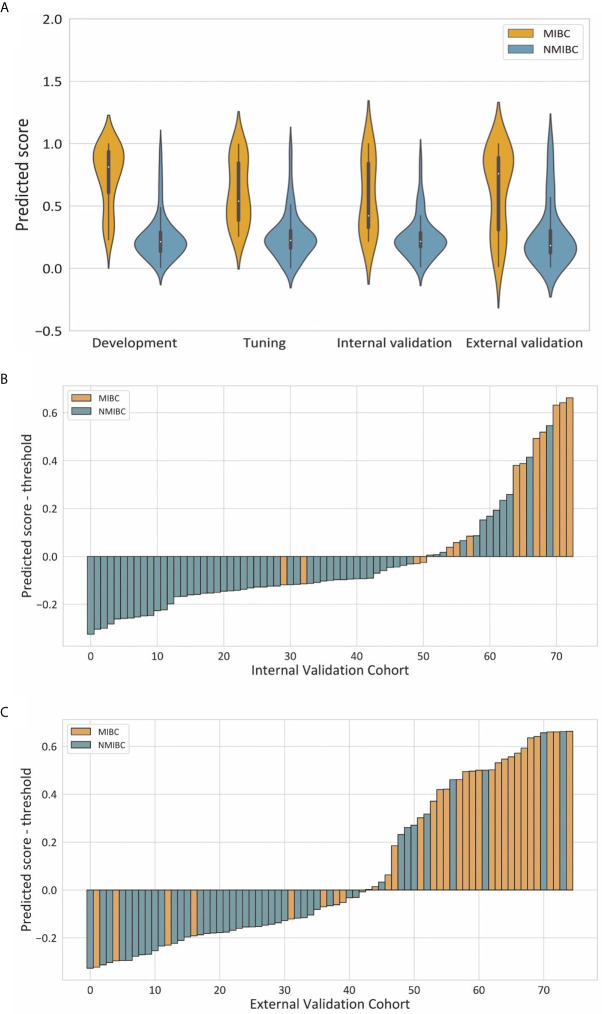
Figure 4.
Illustrations of the performance of the deep learning model. (A) Violin plots of predictive scores in the development, tuning, internal validation and external validation cohorts. (B, C) showed waterfall plots of the distribution of predictive scores and muscle invasive status of each patient in the internal and external validation cohorts respectively.

