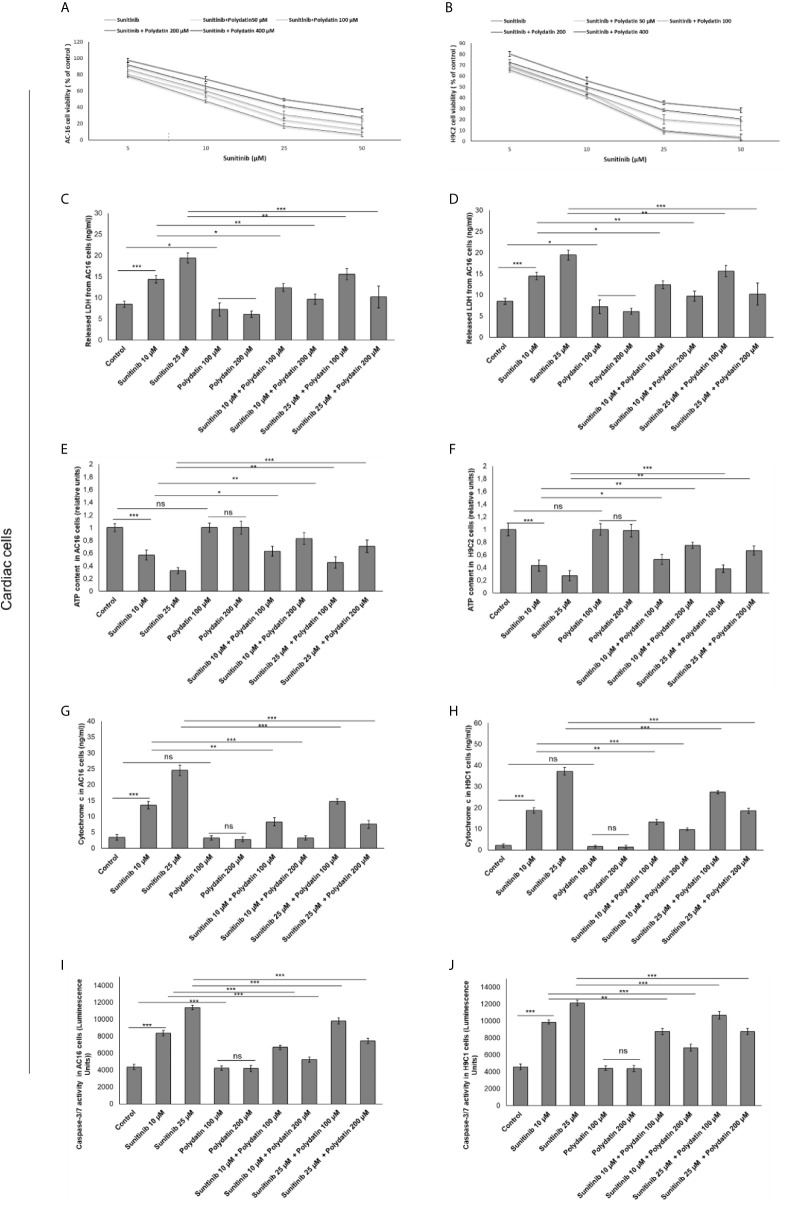
Figure 1.
Cell viability (A, B), cell death determined through LDH releases (C, D), ATP content (E, F), cytochrome c release (G, H) ad apoptosis assay thorough quantification od Caspase3/7 expression (I, J) in cardiac cells (AC16 and H9C2 cell lines) after 48h of incubation with sunitinib, polydatin or both in combination. Error bars depict means ± SD. p-values for the indicated compounds relative to untreated cells are: ***p<0.001. **p<0.01. *p<0.05. ns, not significant.

