Figure 2.

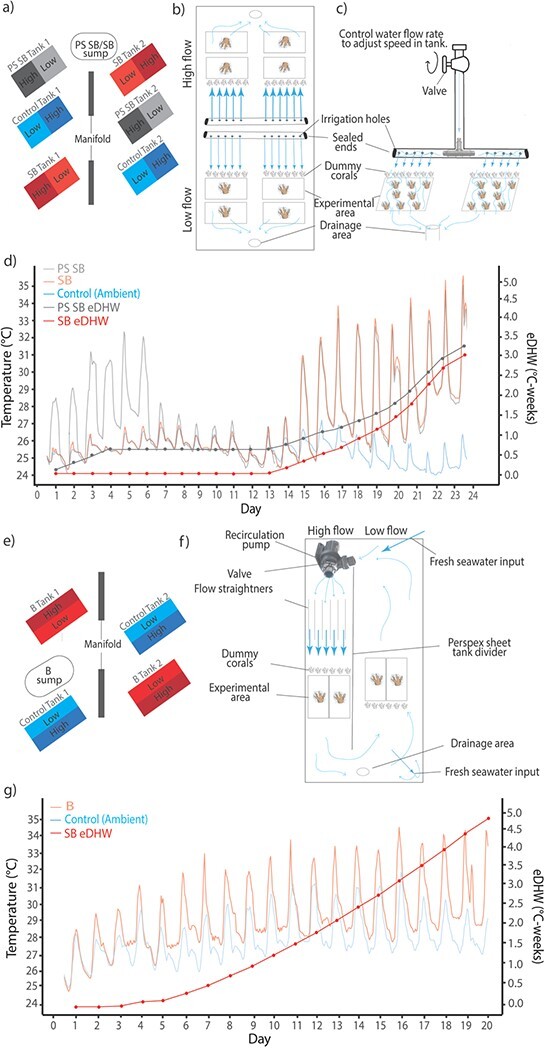
(a) Experimental layout of tanks, Experiment 1. Flow treatments are nested within thermal treatment. PS SB/SB sump is the sump used to heat the PS SB (for the pre-stress stage up to ~32°C, and for the stress treatment up to ~ 34°C), and SB thermal treatment tanks (for the thermal stress period up to ~ 34°C). (b) Diagram of the T-Pipe flow set-up used in Experiment 1. Identical irrigation T-pipes were used for each flow treatment to create target high and low flow speeds of ~0.15 m s−1 and ~0.03 m s−1. (c) Diagram showing a cross-section of the flow set-up used in Experiment 1. High and low flow treatments were created through adjusting of the water into the T-pipe through the valve position. Dummy coral skeletons acted to disturb laminar flow, inducing turbulence and ensuring similar flow conditions experienced by all coral fragments in the experimental area. (d) Experiment 1: sub-bleaching thermal stress experimental period (24 days, 12 April–5 May 2018). Plot displays the hourly average temperature across all treatment tanks. The blue line is the control (ambient) treatment, reflecting temperatures experienced by corals on Heron Island reef flat. The light red line is SB thermal treatment, and the light grey line shows average temperatures in PS SB treatments. (e) Experimental layout of tanks, Experiment 2. Flow treatments are nested within thermal treatment. B sump is used to heat the B thermal treatment (gradual ramping up until ~34°C daily maxima). Thermal stress accumulation was calculated for thermal treatments (PS SB, SB) as eDHW and was shown as dark grey and red lines. (f) Diagram of the recirculation pump flow set-up used in Experiment 2. The recirculation pump was used to move water through flow straighteners across the experimental area, creating target high flow speeds of ~0.15 m s−1. Target flow speeds were created through adjustment of flow rate valve on the pump. Recirculation of water around the tank and loss of water at the drainage point created low flow speeds of ~0.03 m s−1 on the opposite side of the tank. New saltwater input was fed into the tanks adjacent to the recirculation pump input and before water moved over the low flow side of the tank. (g) Experiment 2: thermal stress experimental period (20 days, 4 March–24 March 2019). Plot displays the hourly average temperature across all treatment tanks. The blue line is the control (ambient) treatment, reflecting temperatures experienced by corals on Heron Island Reef flat. The light red line shows temperatures in the B thermal treatment. Thermal stress accumulation was calculated for thermal treatments B as eDHW and is shown by a dark red line.
