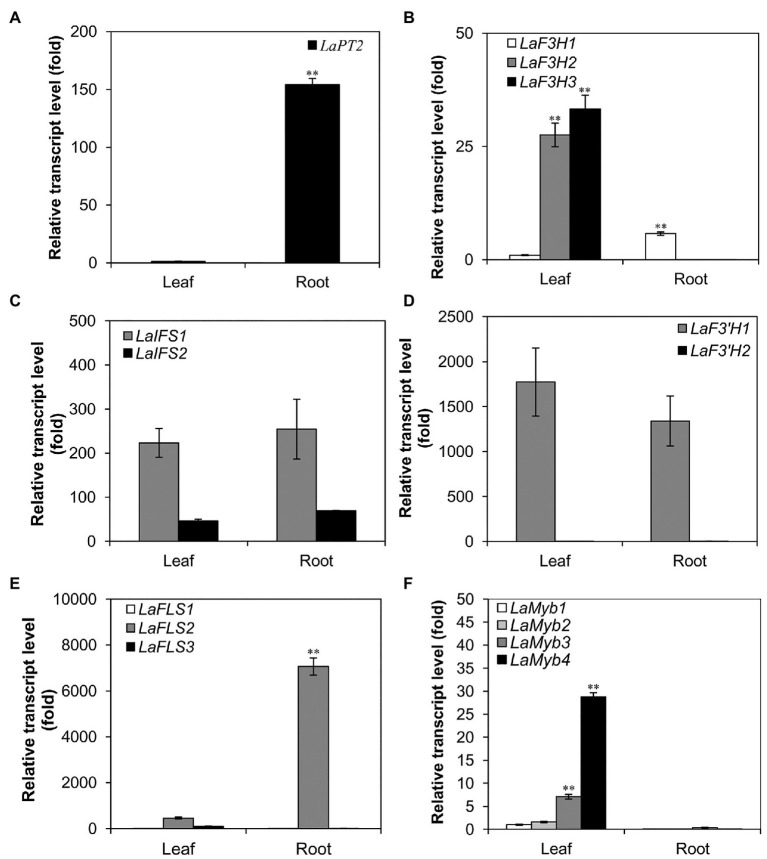
Figure 1.
Expression profile of LaPT2 in leaves and roots of white lupin using quantitative real-time PCR (qRT-PCR) analysis. (A–F) Relative transcript levels of LaPT2 (A), three LaF3H (B), two LaIFS (C), two LaF3'H (D), three LaFLS (E), and four LaMYB (F) in leaves and roots of white lupin. In (A) the expression level of LaPT2 in leaves was set to 1; in (B,C) the expression level of LaF3H1 in leaves was set to 1. In (D) the expression level of LaF3'H2 in leaves was set to 1. In (E) the expression level of LaFLS1 in leaves was set to 1. In (F) the expression level of LaMyb1 in leaves was set to 1. Data are presented as mean ± SD, Student’s t-test (n = 3, ∗∗p < 0.01, comparison between leaves and roots samples for each gene) with three technical duplicates.

