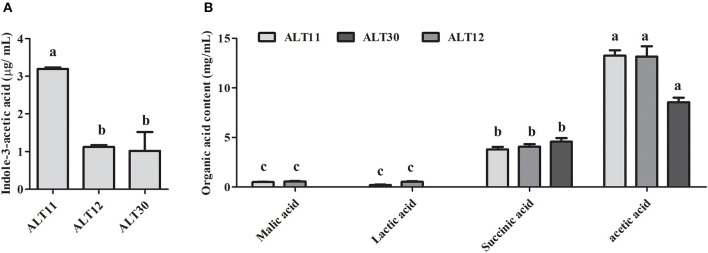
Figure 1.
Quantification of indole-3-acetic acid (IAA) and organic acids produced by isolates ALT11, ALT12, and ALT30. (A) GC/MS-SIM analysis of the IAA content in the culture broth of isolate ALT1, (B) organic acid detection and quantification using high-performance liquid chromatography relative to their respective standard. Different letters indicate significant differences between the mean values of three replicates ± standard deviation.

