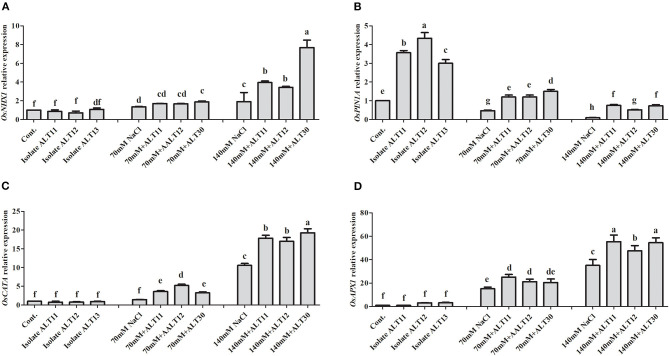
Figure 7.
Gene expression in response to ALT11, ALT12, and ALT30 under normal conditions and NaCl stress. Relative expression of (A) OsNHX1, (B) OsPIN1A, (C) OsCATA, and (D) OsAPX1 genes under normal conditions and NaCl stress (70 and 140 mM) calculated using actin gene expression. Different letters indicate significant differences between the mean values of three replicates ± standard deviation.

