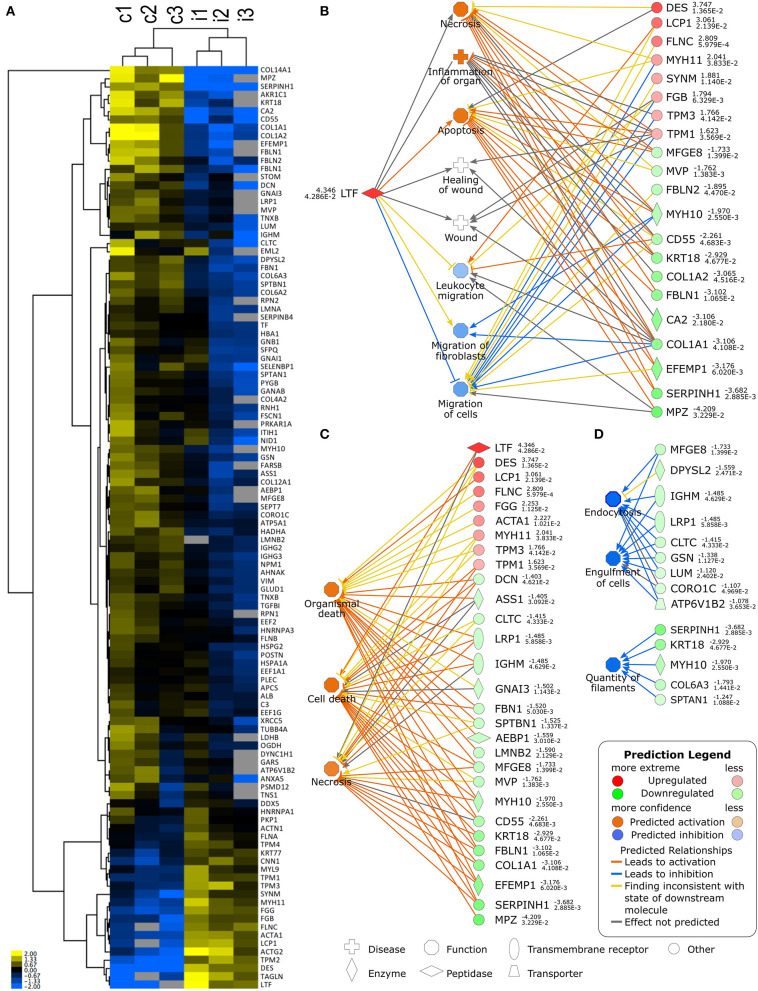
Figure 3.
(A) Heatmap clustering of differentially expressed proteins in three consecutive tissue sections of 3 month follow-up control (c1-3) and injured (i1-3) biopsy samples. (B) Lactoferrin (LTF)-associated activated and inhibited pathways and identified differentially expressed proteins (DEPs) associated to each. (C) Top 3 predicted upregulated pathways and their associated DEPs. (D) Top 3 predicted inhibited pathways and their associated DEPs. Differentially expressed proteins and associated signalling pathways were analysed using Ingenuity Pathway Analysis (IPA).

