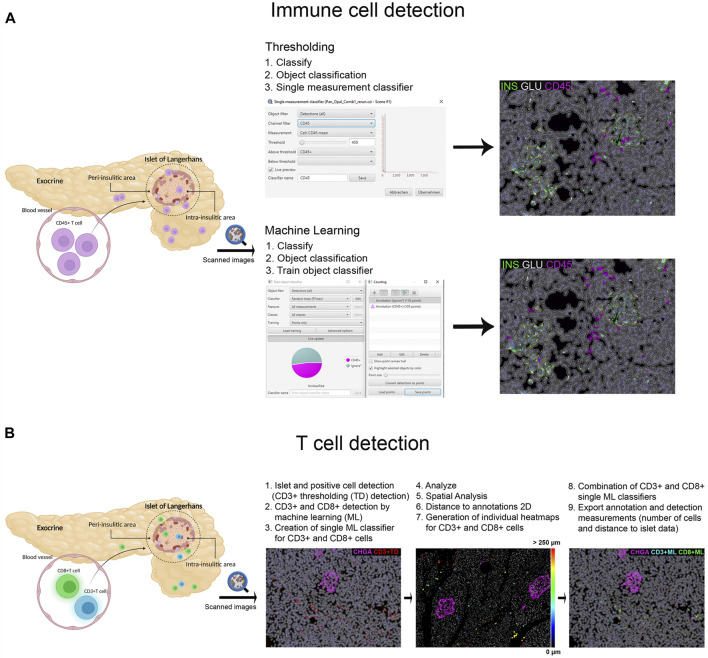
FIGURE 2.
Schematic illustration of the immune cell detection workflow using QuPath. (A) Comparison of the thresholding (single measurement classifier) and the machine learning (train object classifier) option for the detection of CD45+ cells. (B) Workflow for the detection and distance analysis of CD3+ and CD8+ cells detected with thresholding and machine learning. Heatmaps were created to depict the relative distance of CD3+ and CD8+ cells (either individually or combined as one class) to the annotated islets.

