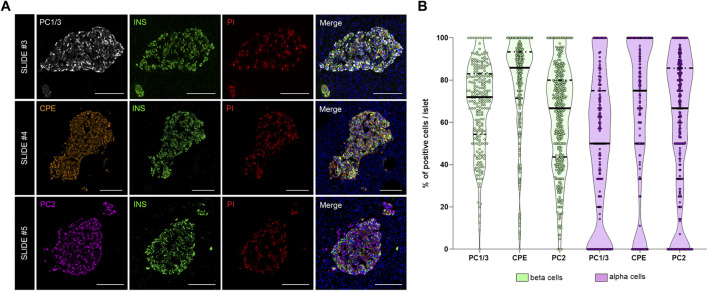
FIGURE 5.
Analysis of the prohormone processing enzymes PC1/3, CPE and PC2 in the endocrine pancreas. (A) Representative images showing the distribution and localization of the proinsulin processing enzymes PC1/3 (slide #3, upper row), CPE (slide #4, middle row) and PC2 (slide #5, lower row) in the islets. (B) Violin plots showing the proportion of PC1/3+, PC2+, and CPE+ cells in beta (green) and alpha cells (violet). Each dot represents an islet. Scale bar: 100 μm.

