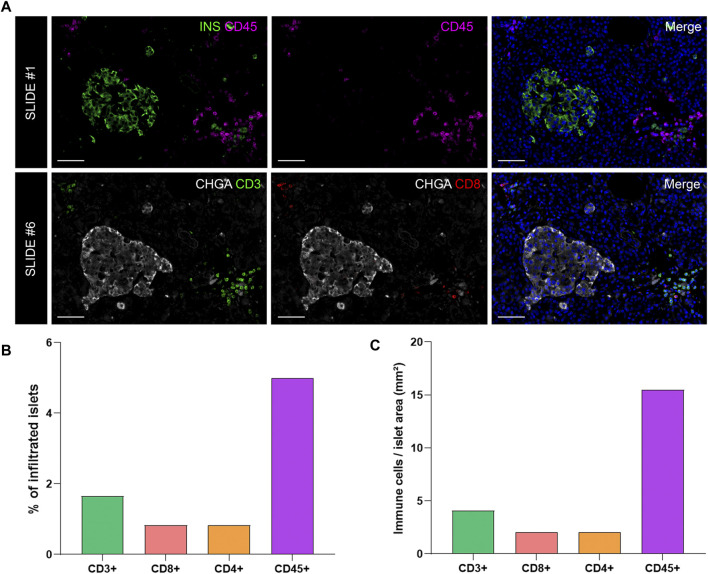
FIGURE 6.
Analysis of the proportion and density of immune infiltration in the exocrine and endocrine pancreas. (A) Representative images of slide #1 showing CD45+ cells in the vicinity of an insulin-containing islet (upper row) and representative images of slide #6 showing CD3+ (lower row left) and CD8+ (lower row middle) cells close to a chromogranin A positive (CHGA+) islet. (B) Bar graphs show the proportion of infiltrated islets by CD3+, CD8+, CD4+, and CD45+ positive cells expressed as percentage of total islets. (C) Bar graphs show the density of CD3+, CD8+, CD4+, and CD45+ cells expressed as number of cells per islet area (mm2). Scale bar: 50 μm.

