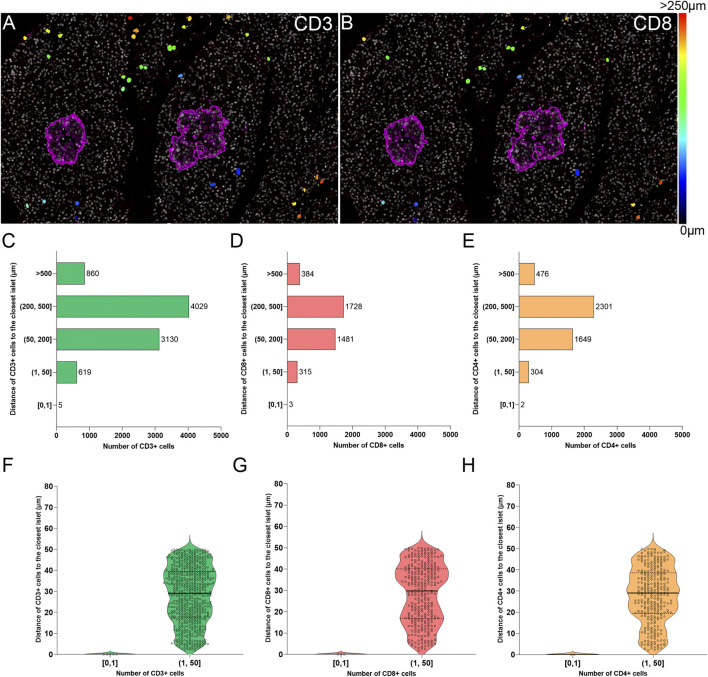
FIGURE 7.
Two-dimensional spatial analysis of the localization and distance of immune cells to the islets. Heatmaps showing the distance of (A) CD3+ and (B) CD8+ cells to the closest islet. Scale: 0 (black-blue)—>250 (red) μm. (C) Bar graph showing the distribution of CD3+, (D) CD8+, and (E) CD4+ cells in five different distance categories to the closest islet: [0, 1), (1, 50], (50, 200], (200, 500], and >500 μm. (F) Violin plots showing the number of CD3+, (G) CD8+, and (H) CD4+ cells in the intra-islet [0, 1) and peri-islet (1, 50 μm]. Each dot represents a cell.

