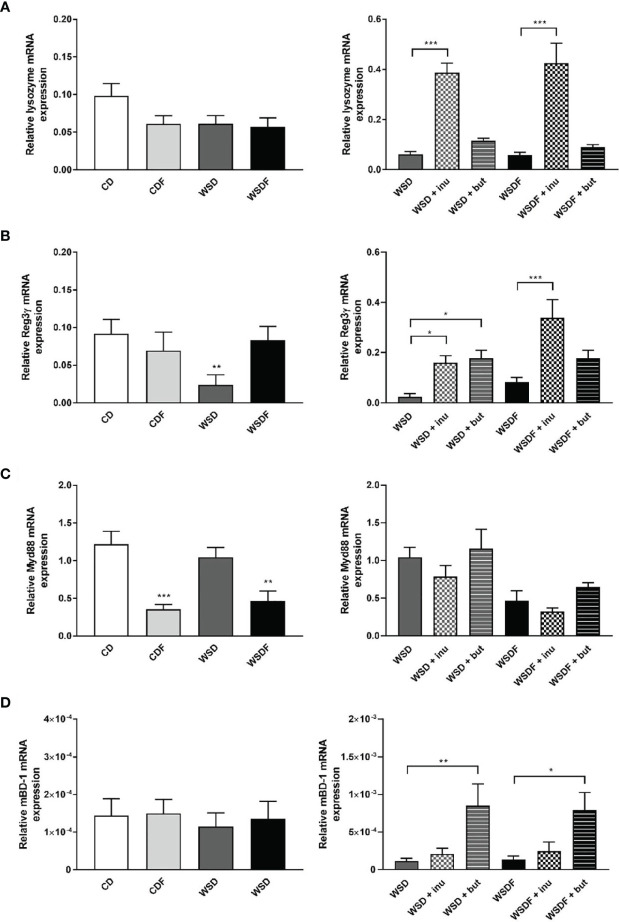
Figure 4.
Effects of inulin and sodium butyrate on antimicrobial peptide expression. C57BL/6 mice fed different diets as described in Figure 1 are shown. Relative mRNA expression level of lysozyme (A), Reg3γ (B), MyD88 (C) in the ileum and mBD-1 (D) in the colon determined by quantitative RT-PCR. Data are presented as means +/- standard error of the mean (SEM) (n= 6–8). Statistical analysis was performed by one-way ANOVA with Dunnett´s or Sidak´s post-test or by Kruskal-Wallis-test for non-parametric data with a Dunn’s post-test. Significant differences are indicated as *p-value < 0.05; **p-value < 0.01; ***p-value < 0.001.

