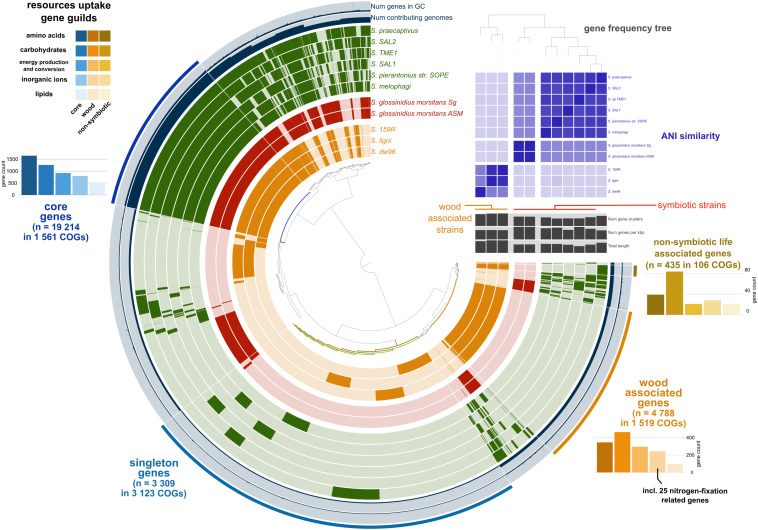
FIGURE 1.
Pangenome analysis of the available Sodalis genomes. Genes (indicated by dark colors within the circles) were clustered based on orthologous similarity (inner tree), and genome layers were sorted based on a gene frequency tree (right upper tree). Sodalis guilds are color coded; deadwood-associated strains in orange, tsetse fly symbionts in red and insect symbionts with S. praecaptivus in green. ANI is indicated as the upper right heatmap. Pangenome analysis identified core genes shared by all genomes (bar plots in hues of blue), genes associated with non-symbiotic life (bar plots in hues of yellow) and genes associated with wood habitat (bar plots in hues of orange). Individual bar plots show counts of genes divided according to their function.

