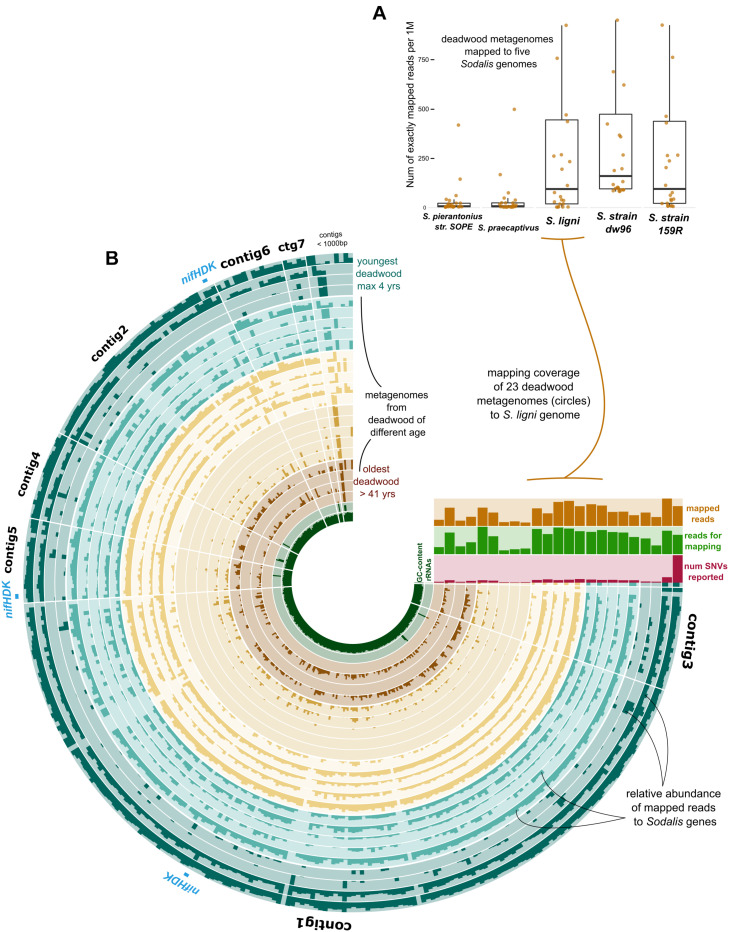
FIGURE 4.
Deadwood metagenome mapping against the genome of S. ligni. (A) Boxplots show deadwood mapping count for wood-associated strains and S. pierantonius strain SOPE and S. praecaptivus. (B) The anvi’o plot with circles representing metagenome samples, the color coding of circles follows grouping of samples based on the length of deadwood decomposition. Dark bar plots within circles represent the relative abundance of reads mapped to S. ligni genes. Contigs were ordered based on the Euclidean distance and Ward linkage.

