
Figure 5.
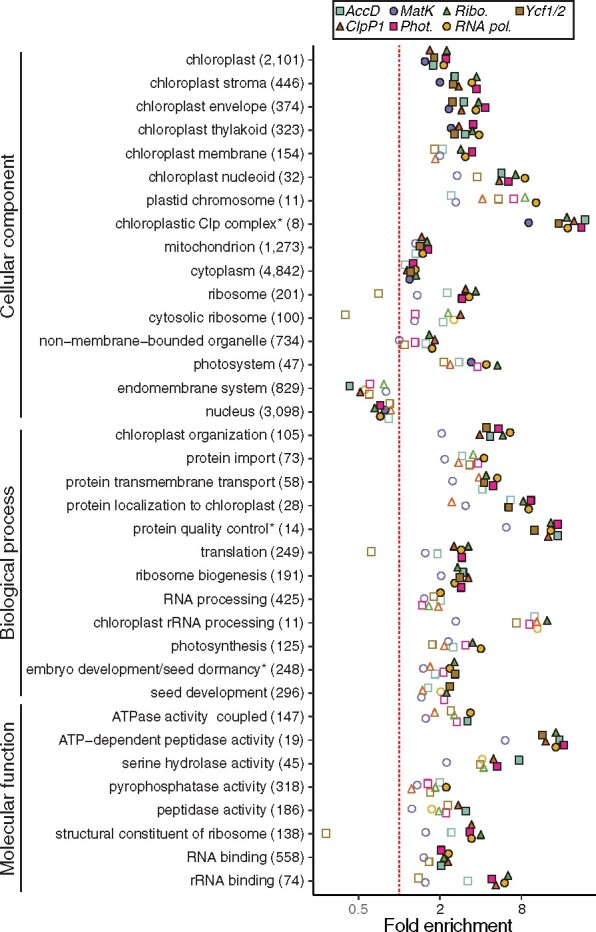
Functional enrichment of ERC hits. GO functional enrichment analyses were performed for ERC hits from each of the plastome partitions. Categories with significant enrichment/depletion in at least one partition are shown. Categories are grouped by type of GO annotation (cellular component, biological process, and molecular function). Some redundant or highly overlapping categories were removed (see Supplemental Data for full results). Asterisks indicate shortening of category name to fit figure dimensions. The number of total genes in each category is indicated in parentheses. Statistical significance of enrichment/depletion (Fisher’s exact test) is indicated by filled points (P <0.05). P values were corrected for multiple tests using FDR.