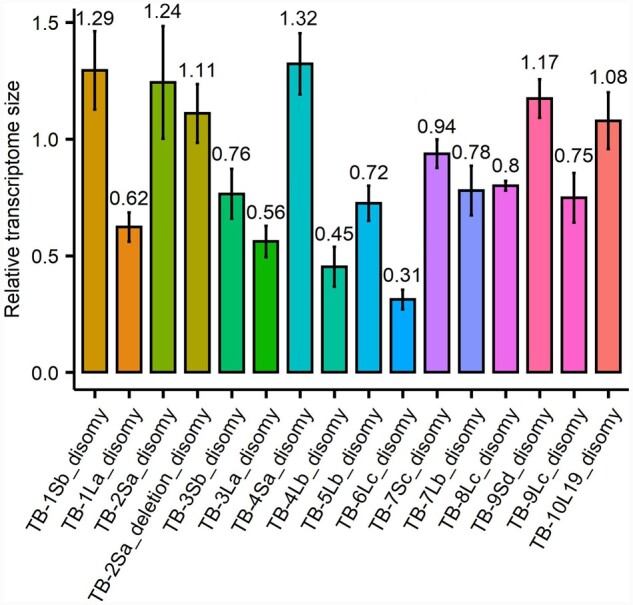
Figure 4.

Transcriptome size measurement. There are eight independent estimates (eight genes) of transcriptome size in each disomy by comparing the relative expression per cell (disomy/haploid) from ddPCR to the relative expression per transcriptome (disomy/haploid) from RNA-seq data. The x axis is the average value of eight estimates and the bar is standard deviation across the eight estimates.
