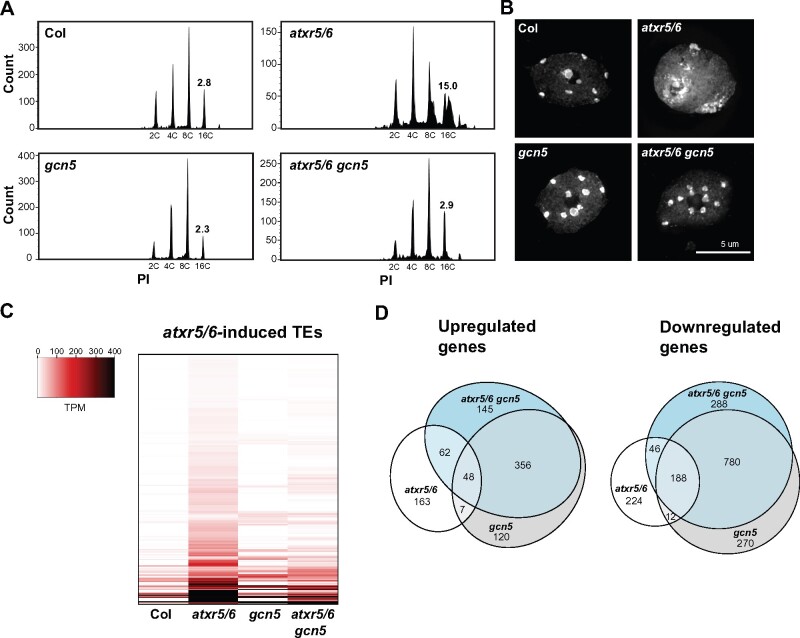
Figure 1.
A mutation in GCN5 suppresses transcriptional de-repression and heterochromatin amplification associated with H3.1K27me1 depletion. (A) Flow cytometry profiles of Col, atxr5/6, gcn5, and atxr5/6 gcn5 nuclei stained with propidium iodide (PI) with 2,000 gated events. The numbers below the peaks indicate ploidy levels of the nuclei. The numbers above the 16C peaks indicate the robust coefficient of variation (CV). (B) Leaf interphase nuclei of Col, atxr5/6, gcn5, and atxr5/6 gcn5 stained with DAPI. (C) Heat map showing the relative expression levels of 486 atxr5/6-induced TEs (Supplemental Data Set 1) as measured by TPM (transcripts per million) in Col, atxr5/6, gcn5, and atxr5/6 gcn5. (D) Euler diagrams showing the number of upregulated and downregulated genes (two-fold change) in atxr5/6, gcn5 and atxr5/6 gcn5 compared to Col plants (Padj <0.05).

