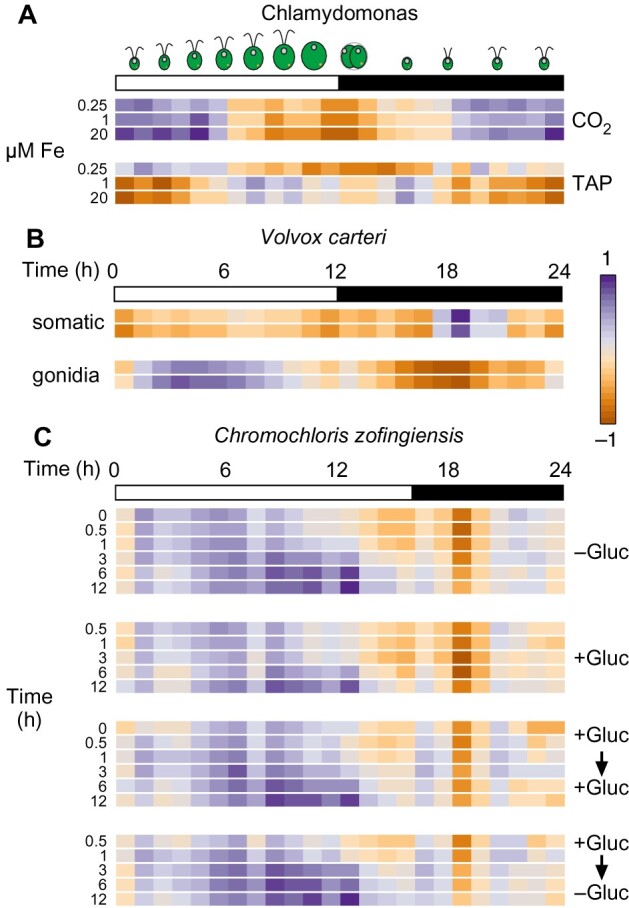
Figure 10.

Application of the molecular timetable method to independent RNA-seq experiments across algae. A), Reanalysis of a transcriptome dataset included in our initial RNA-seq data (Urzica et a., 2012b). We subjected FPKM values to log2 normalization, followed by normalization to the mean (obtained during the normalization steps that yielded RNAseq4). We then used the molecular timetable method to determine the rhythmic pattern of the samples (Chlamydomonas CC-4532 strain grown in Tris Acetate Phosphate (TAP) or Tris Phosphate (CO2) medium with 0.25, 1, or 20 µM FeEDTA). B), Molecular timetable method applied to V. carteri samples collected in duplicates from somatic or gonidial cells (Matt and Umen, 2018). C), Molecular timetable method applied to C. zofingiensis samples collected over 12 h after addition and removal of glucose (Roth et al., 2019). For (A), we used 960 highly rhythmic genes to draw the heatmap. For (B) and (C), we included all rhythmic genes with orthologs in V. cateri (B) or C. zofingiensis (C), after log2 normalization and normalization with the Chlamydomonas-derived gene means.
