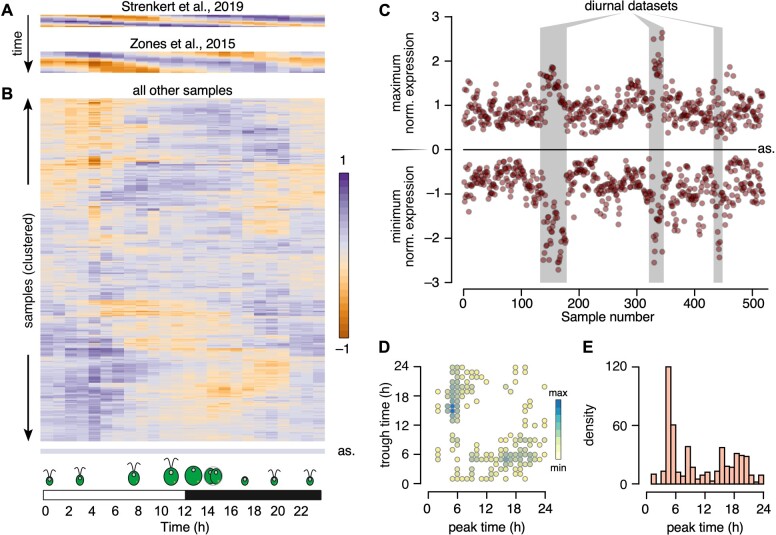
Figure 9.
Chlamydomonas cultures grown in constant light retain substantial rhythmicity. A), Heatmap representation of the molecular timetable approach, applied to two diurnal datasets: Strenkert et al. (2019) and Zones et al. (2015). B), Heatmap representation of the molecular timetable approach, applied to all remaining RNA-seq samples. In panels (A) and (B), each sample is represented as the mean expression of 20 phase marker genes (per h). In (A), diurnal samples are ordered from top to bottom. For (B), samples were subjected to hierarchical clustering while generating the heatmap in R. as: heatmap from an asynchronous sample, corresponding to the average expression of all rhythmic genes for each time point. C), Scatterplot of minimum and maximum normalized expression across all RNA-seq samples. Diurnal time courses are indicated by a gray shade. as: expected position of minima and maxima for a completely asynchronous sample. The samples are ordered by experiments, therefore consecutive data points belong to the same experiment. D), Peak and trough times largely occur 12 h apart. Scatterplot of all peak expression time (x-axis) and trough times (y-axis). E), Distribution of peak times across all RNA-seq samples.

