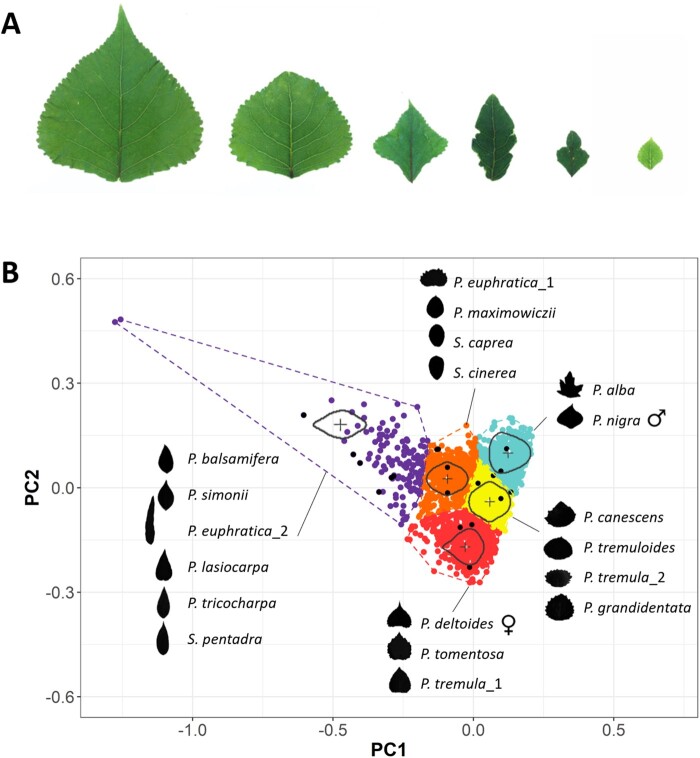
Figure 3.
Overview of the diversity in leaf shape and leaf size within the indel mutant population. (A) Striking differences in leaf shape and leaf size were observed among the lesion lines. Control non-lesion lines were overall more similar to the left-most photograph. (B) K-means clustering of the first and second PCs of the symmetric elliptical Fourier quantitative variables. Analyses were performed on leaf outlines from individual ramets of the indel mutant population, their parental lines female P. deltoides and male P. nigra, as well as some representative species of the Populus and Salix genera. For individuals from the indel population, each of the five K-means clusters was plotted in different colors. Black dots were used for the other representative species. The mean leaf outline of each cluster is represented in the center of its corresponding cluster. Leaf outlines from the other species are represented on the side of their corresponding cluster.

