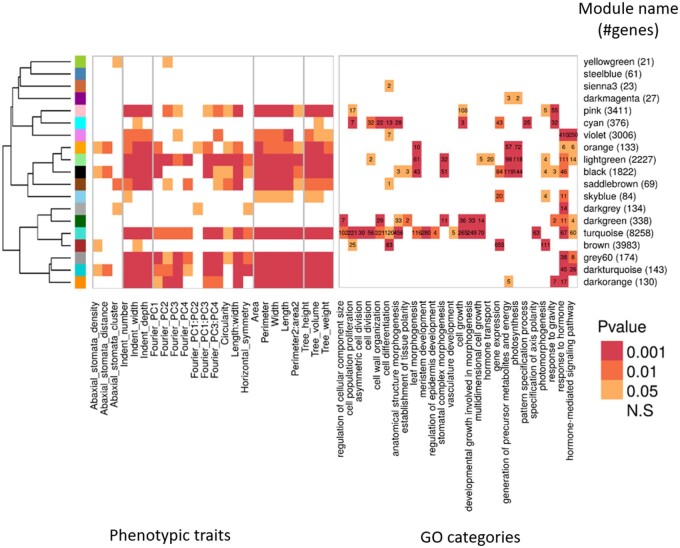
Figure 6.
Relationship between module expression and trait values. Module to phenotypic trait relationship is measured by the P-value of the Pearson correlation between the modules’ eigengene expression and the phenotypic BLUP values. Rows were ordered according to a hierarchical clustering of the eigengene expression of each module across the tree lines, as represented by the hierarchical tree clustering on the far left. X symbols indicate occurrence of colocalization between the phenotype-dQTL and the module-dQTL. Right: Module to GO relationship as measured by the P-value of the GO enrichment. In each cell, we indicated the number of genes belonging to children GO terms showing significant enrichment in the various modules, when compared with all the genes expressed in leaves. Color, from light orange to dark red indicates significance levels at P < 0.05, P < 0.01, and P < 0.001.

