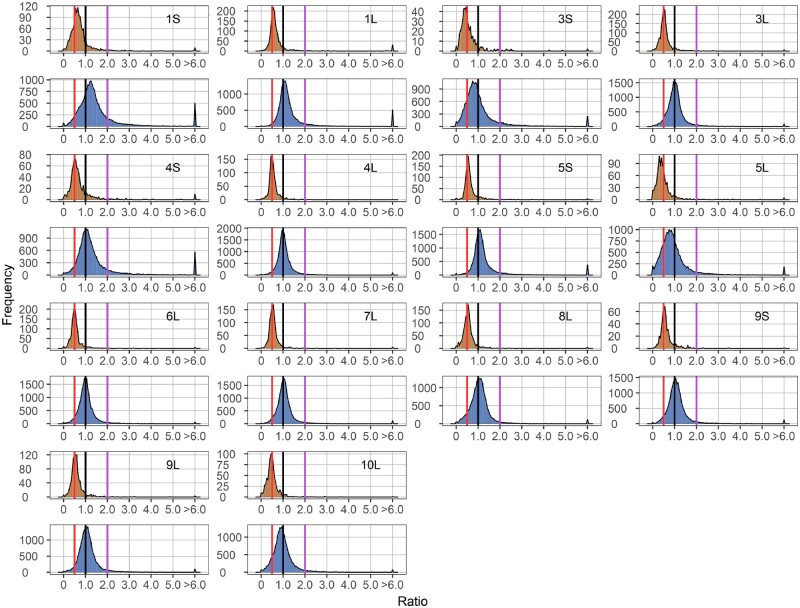
Figure 1.
Ratio distributions of gene expression in each monosomy compared with diploids (1D/2D). Genes were partitioned into those encoded on the varied chromosome (cis) versus those encoded on the remainder of the genome that were not varied in dosage (trans). Normalized read counts for each gene were averaged across biological replicates and were then used for the generation of ratios comparing each experimental group to the control. Cis distributions were painted in orange, while trans distributions were painted in blue. Gene ratios for each pair of comparison were plotted on the x-axis with a bin width of 0.05. The y-axis notes the number of genes per bin (frequency). A ratio of 0.5 represents a gene-dosage effect in cis, whereas 1.0 represents dosage compensation. A ratio of 2.0 represents the inverse ratio of gene expression in trans, whereas 1.0 represents no change and 0.5 represents a positive modulation. These ratio values are demarcated with labeled vertical lines in red (0.5), black (1.0) and purple (2.0).

