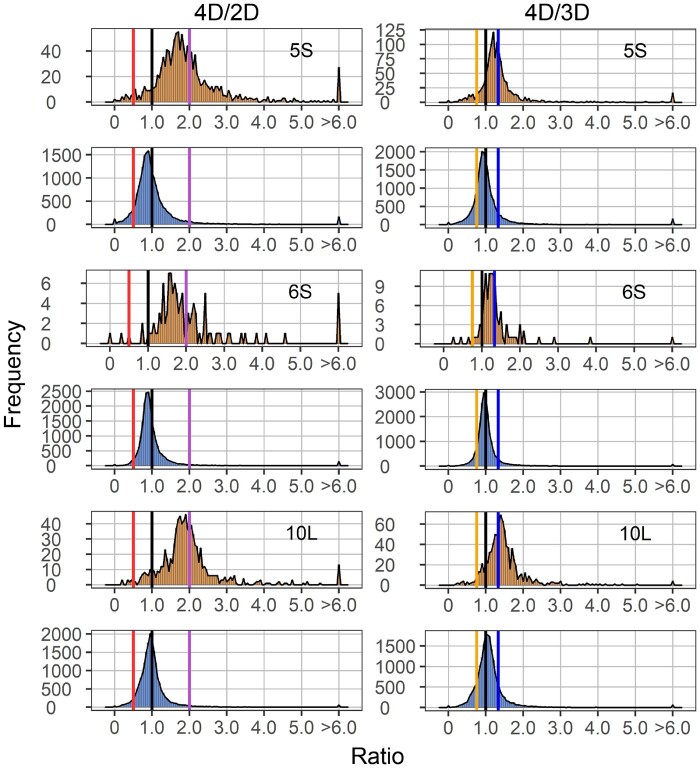
Figure 3.
Ratio distributions of gene expression in each tetrasomy compared with diploids (4D/2D) or trisomies (4D/3D). Analysis was conducted as described in Figure 1. Ratios of 2.0 (4D/2D) and 1.33 (4D/3D) represent a gene-dosage effect in cis, whereas 1.0 represents dosage compensation. Ratios of 0.5 (4D/2D) and 0.75 (4D/3D) represent the inverse ratio of gene expression in trans, whereas 1.0 represents no change. Ratios of 2.0 (4D/2D) and 1.33 (4D/3D) represent a positive modulation in trans. These ratio values are demarcated with labeled vertical lines in red (0.5), orange (0.75), black (1.0), blue (1.33), and purple (2.0).

