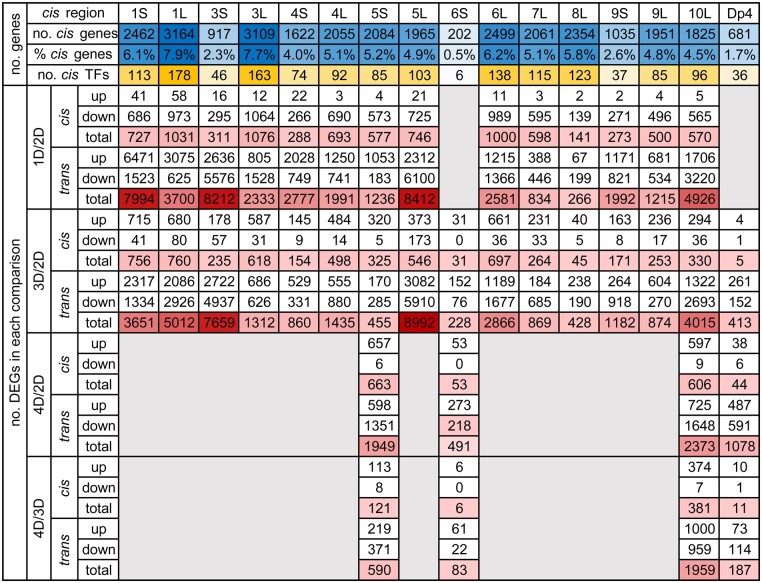
Figure 4.
Number of cis genes and TFs in each aneuploidy line as well as the number of upregulated and downregulated DEGs in each comparison. Up, upregulated DEGs; down, downregulated DEGs; total, all DEGs in each comparison. The blue color is scaled to the number (no.)/proportion (%) of cis genes while the orange color to the number of cis TFs. The red color is scaled to the number of total DEGs. DEGs were computed by significance (q value <0.05), as in each scatter plot in Supplemental Figure S2.

