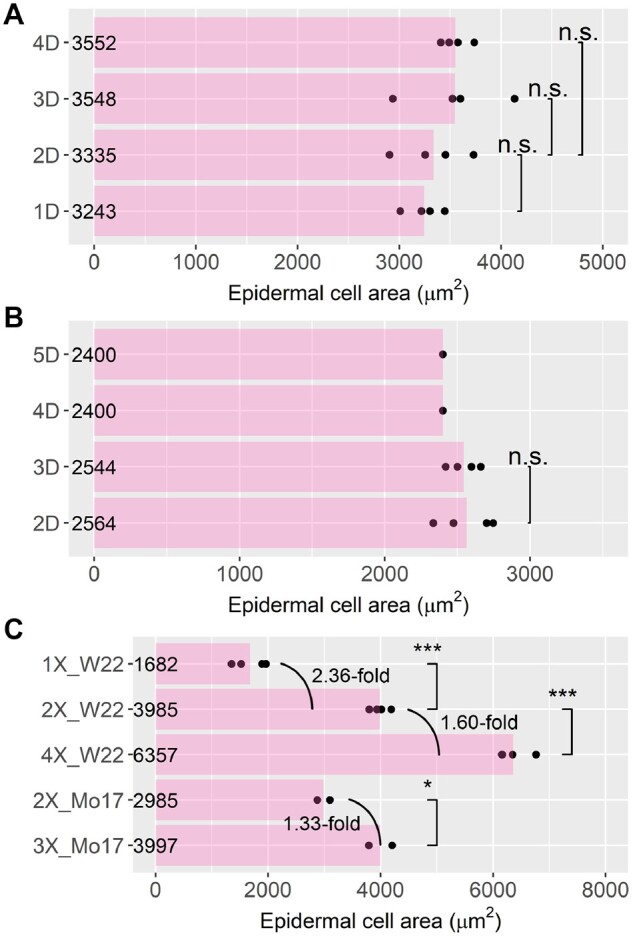
Figure 7.

Epidermal cell area of aneuploids and polyploids. Asterisks indicate significant differences (Student’s t test: *P <0.05; ***P <0.001; n.s., P ≥0.05). Epidermal cell area of 5S aneuploids (A), 6S aneuploids (B), and the ploidy series (C). Each point represents data for one biological replicate.
