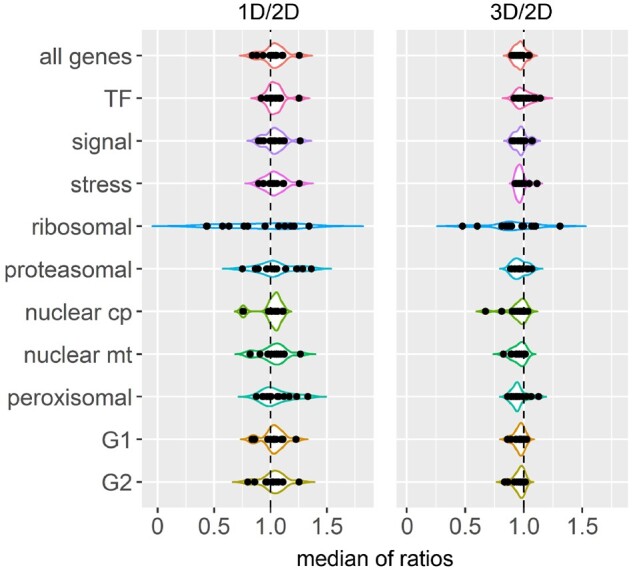
Figure 8.

Median of trans ratios of each functional class and maize subgenome in each distal aneuploid line. X-axis refers to median of trans ratios computed as in Supplemental Data Set 1, whereas the y axis denotes functional classes or maize subgenomes (G1 and G2). Each data point represents the median of one distal aneuploid in the corresponding group. Medians of ratios in the 1D/2D comparison are shown on the left while those in the 3D/2D comparison are presented on the right. The black dashed line represents no change of gene expression in trans (ratio 1.0). Cp, chloroplast; mt, mitochondrial.
