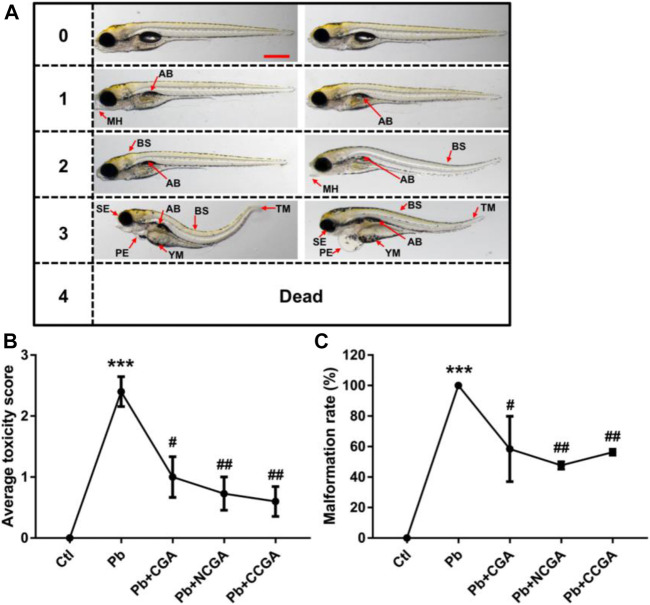
FIGURE 2.
Micrographs, average toxicity scores, and malformation rate. (A) Representative images of toxicity score from 0 to 4 at 120 hpf. Zebrafish malformation was scored from level 0 to level 4.0, zebrafish developed normally; 1–3, zebrafish had slight-to-severe defects; 4, embryonic lethality. Two images for each of semiquantitative toxicity scoring indicate that both of these abnormalities are ranked as the same toxicity score (scale bar, 500 μm). (B) Average toxicity score at 120 hpf (n = 6); *** p < 0.001 vs. control and # p < 0.05, ## p < 0.01 vs. Pb. (C) Pb-induced phenotypic defects and malformation rate (n = 15); *** p < 0.001 vs. control and # p < 0.05, ## p < 0.01 vs. Pb.

